 Stopping the US Economy from Shrinking: It’s Women’s Work
Last week, the Bureau of Economic Analysis reported that the US economy shrunk for a second consecutive quarter.
The day before the data was released, the Federal Reserve increased the Fed Funds interest rate by 75 basis points. It was the second consecutive ¾ percentage point interest rate hike and it brought the benchmark to a range of 2.25-2.50 percent, its highest level since December 2018.
During his press conference, Federal Reserve Chairman Jerome Powell characterized the level of the Fed Funds as broadly neutral. He stated that additional interest rate increases will be needed to further slow economic activity and suggested that the Fed Funds range will likely rise to 3.25-3.50 percent by the end of this year and by an additional 50 basis points in 2023.
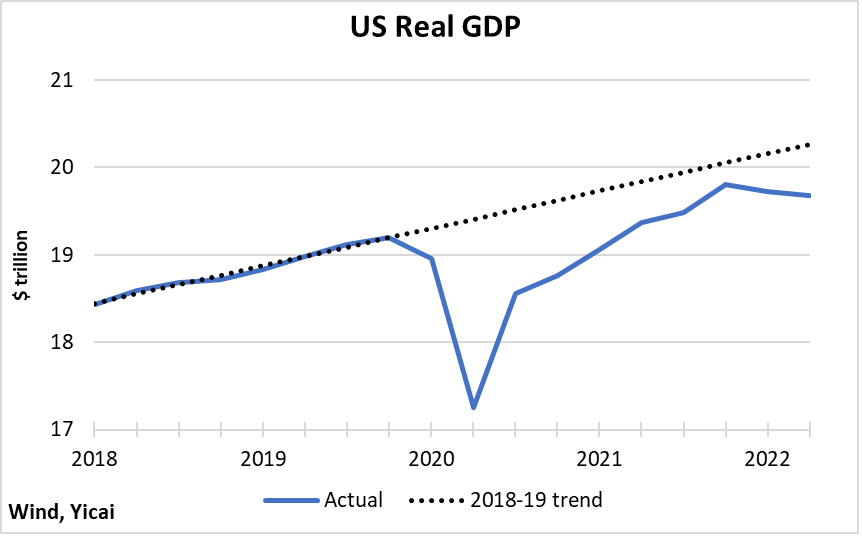
The level of US GDP is 2.5 percent higher than its pre-pandemic peak. However, after two quarters of decline, it is close to 3 percent below its 2018-19 trend (Figure 1). Normally, falling this far below trend would indicate that there is considerable slack in the economy. Given this slack, why then is the Fed planning to raise rates further and engineer a more of a slowdown?
Figure 1
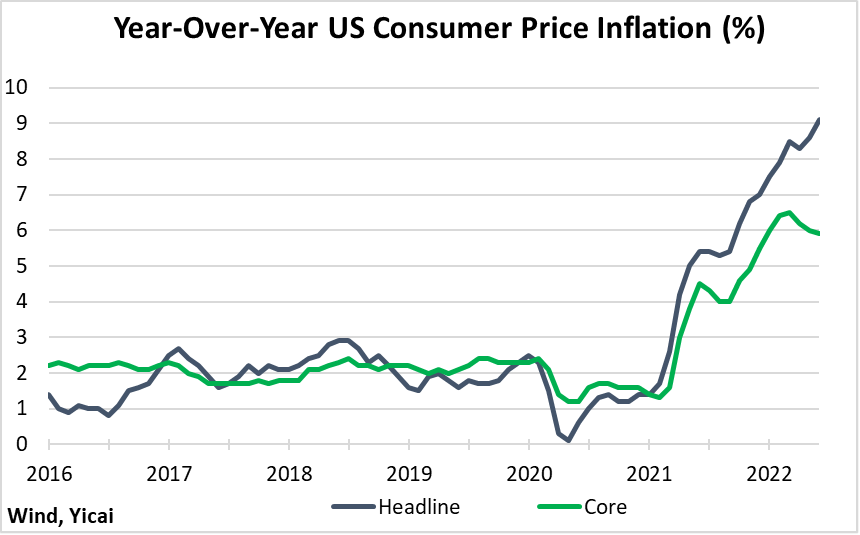
Inflation has been higher and much more persistent than the Fed expected. In June, headline consumer price inflation exceeded 9 percent, its highest reading in more than 40 years! Core inflation, which excludes food and energy prices, dipped below 6 percent but it too remained at a historically high rate (Figure 2). The Fed’s long-run objective is to achieve maximum employment and 2 percent inflation. It is, therefore, very concerned.
Figure 2
Inflation dynamics over the last year and a half have been complex and it has been difficult to tease apart the temporary and longer-lasting factors.
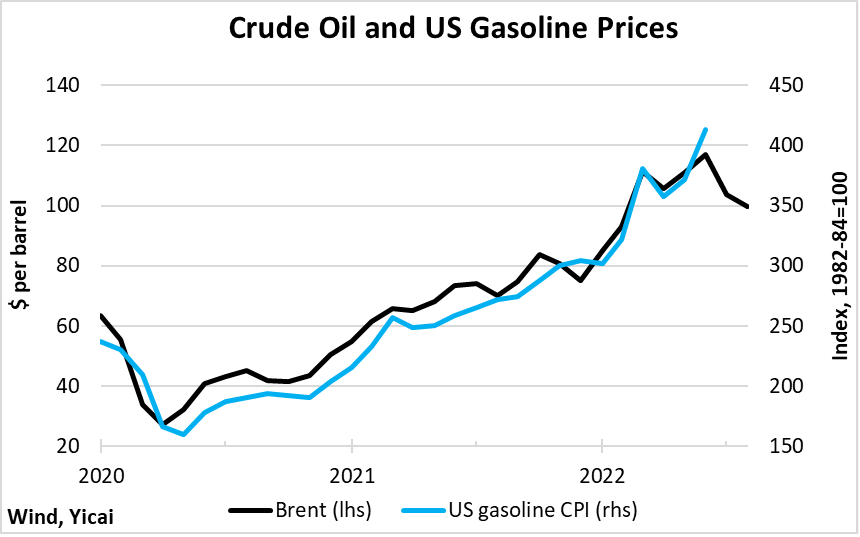
Crude oil prices have essentially doubled since 2020 (Figure 3). As a result, US gasoline prices were up 60 percent year-over-year in June. While the average American household only spends 4 percent of its budget on gasoline, the rapid rise in pump prices is enough to add 2.4 percentage points to headline inflation.
Higher crude oil prices ripple through the economy and raise the costs of many goods and services. Still, economists tend not to think of higher oil prices, in themselves, as inflationary. This is because higher oil prices are a relative price change while inflation is an increase in the level of prices in general. Moreover, inflation refers to a process of continuous price increases. Crude oil prices tend to behave cyclically – they rise for a while and then fall, as consumers economize on oil-intensive products and more supply comes on stream.
Figure 3
Since oil price changes can deeply distort the inflationary picture, economists like to look at core measures which exclude energy and other volatile components. Chairman Powell said that while the Fed’s mandate is defined in terms of headline inflation, it feels that core inflation is actually a better measure of future headline inflation than headline inflation itself.
As Figure 3 shows, it appears that crude oil prices may have peaked in June. While energy-related prices could remain high for some time, crude oil’s inflationary impact could very well fade over the next 12 months.
Supply chain disruptions are another temporary shock that has sent prices higher. The turmoil caused by the pandemic led to severe difficulties in the production of some goods – like semiconductors – and to backlogs at international ports.
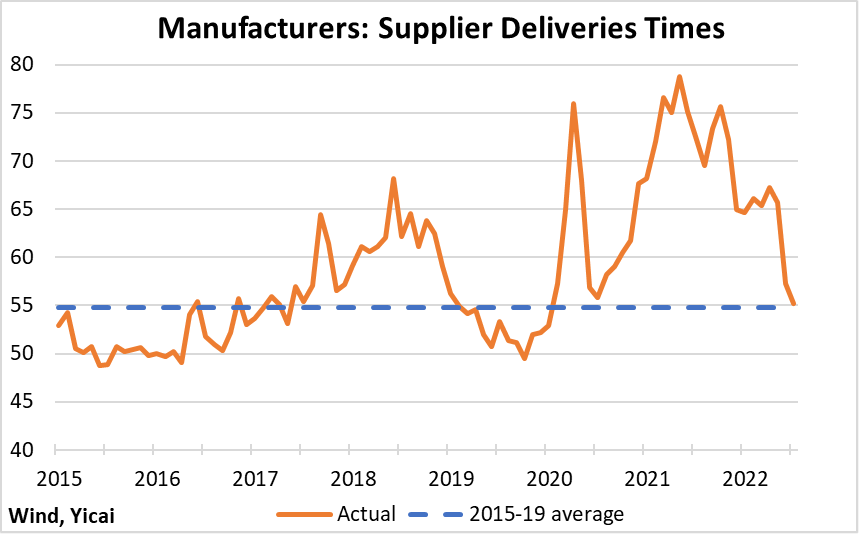
The good news is that these bottlenecks appear to have reversed themselves. The Institute of Supply Management’s monthly measure of “Supplier Delivery Times” is a useful proxy for the bottlenecks. They fell sharply in June and continued to ease in July. The July level is about the same as the 2015-19 average (Figure 4). This suggests that supply chain disruptions are much less of a problem now than they had been over the last two years.
Figure 4
Looking through these temporary shocks, the key to understanding persistent inflation in the US lies in its labour market. Many commentators have focused on the monthly increases in payroll employment, which have, indeed, been impressive. However, the monthly changes hide the fact that the US labour market was deeply scarred by the pandemic.
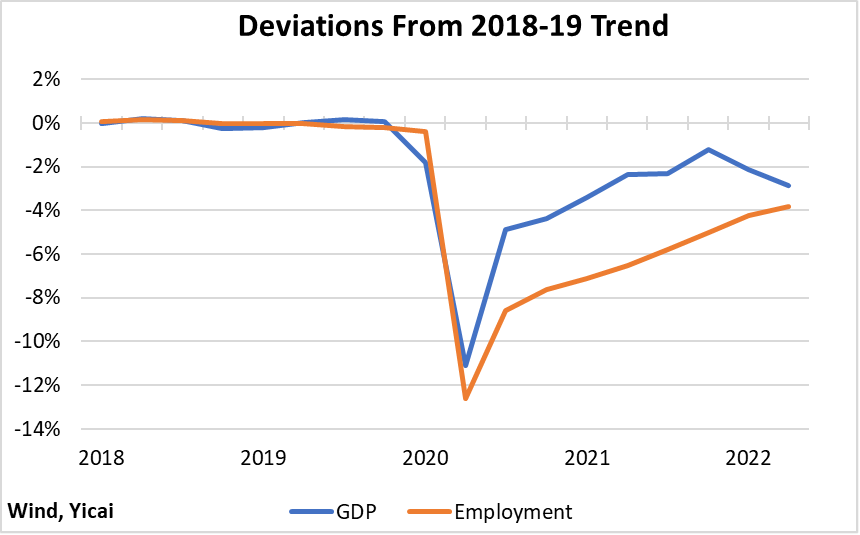
Figure 5 compares employment’s deviation from its 2018-19 trend to that of GDP’s. It shows that employment fell further and has recovered more slowly. Employment’s larger deviation from trend indicates that the slack in the economy depicted in Figure 1 is illusory. In fact, the economy is in excess demand. Aggregate demand (the GDP deviation) has exceeded aggregate supply (the employment deviation) for the last two-and-a-half years. Thus, it is no wonder that core inflation has increased by 4 percentage points from late 2019.
Figure 5
The employment of men is slowly returning to trend. However, that of women has remained stuck some 4 percent below trend for the last two years (Figure 6). In many cases, women are the low-income-earning spouse. With the potential for contracting Covid still high, many have chosen to stay at home and care for their children or other family members.
Figure 6

Given the predominance of women in the caring professions, their withdrawal from the labour force may be having a snowballing effect on female employment.
Take day care for example. In June, employment in child day care services was 10 percent below the pre-pandemic peak (Figure 7). Had the trend in daycare employment continued at its 2018-19 rate, there would have been some 200,000 more daycare employees than June’s 950 thousand. If each one of these employees looked after five children, a million women might have been able to rejoin the labour force. That’s about one-third of June’s missing female workers.
Figure 7

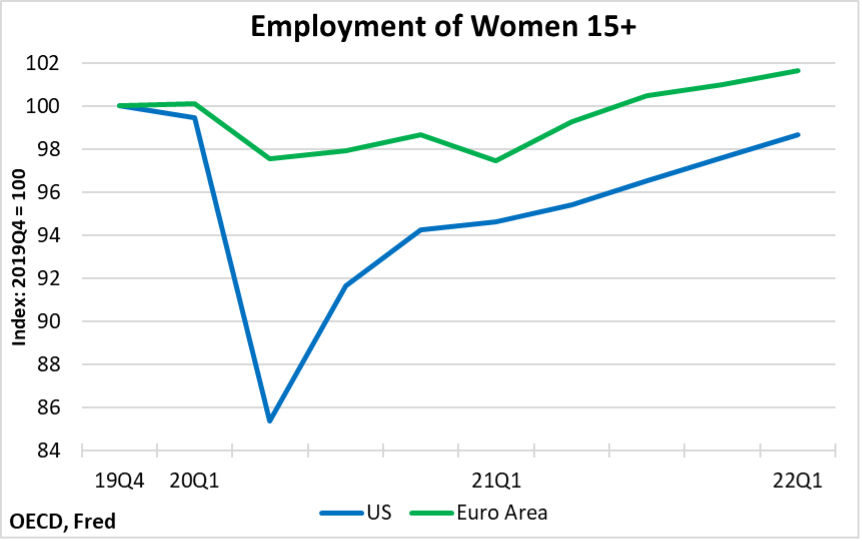
European countries have universal health care and they provide more generous child care and sick leave benefits than the US does. And they have been more successful at maintaining the employment of women through the pandemic (Figure 8). This is, in part, why core inflation in Europe has been about two percentage points lower than in the US even though the two economies’ post-pandemic economic performances have been broadly similar.
Figure 8
The recently released National Accounts data are consistent with the story of the US’s scarred labour market keeping aggregate supply below aggregate demand (Figure 9).
Figure 9
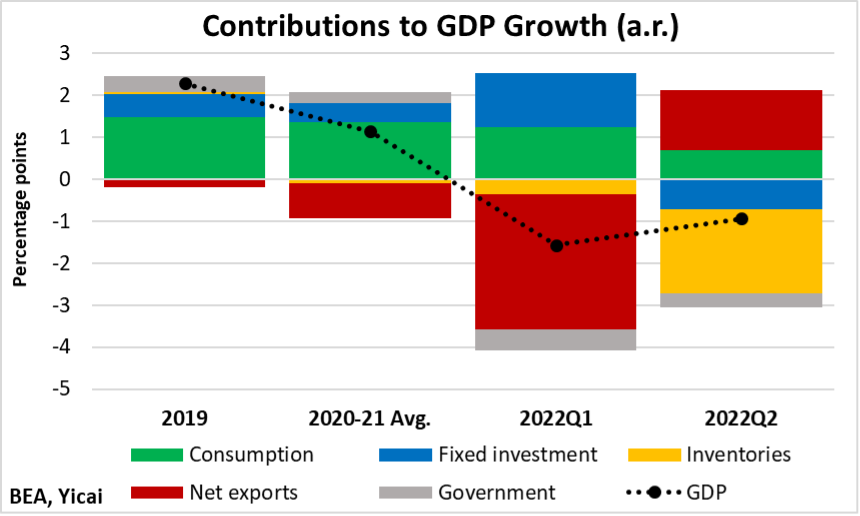
In the first quarter, final sales to domestic purchasers (consumption plus fixed investment) were relatively robust. But the supply side of the economy had difficulty in servicing this demand, which was ultimately satisfied by increased imports (a reduction in net exports) and an inventory drawdown.
In the second quarter, final sales to domestic purchasers were essentially zero, as rather weak consumption was offset by a decline in investment. Net exports rebounded but they had to be supplied through a large reduction of inventories rather than current production.
Looking ahead, the Federal Reserve will likely keep aggregate demand below aggregate supply for a significant period of time in order to bring core inflation from close to 6 percent down to 2 percent.
However, the pain of high interest rates and spending reductions could be alleviated by boosting aggregate supply through activist labour market policies that facilitate women’s return to their workplaces.