 Is China’s Five Percent GDP Growth Credible?
(Yicai) Jan. 13 -- The New York Times recently ran a questioning President Xi’s statement that China’s GDP grew by close to 5 percent last year. The Times pointed to by the Rhodium Group, a consulting firm. Rhodium said China’s “true” GDP growth was between 2.4 and 2.8 percent.
Putting a country’s GDP numbers together is as much an art as it is a science. Statisticians need to wrestle with data limitations, measurement difficulties and economies’ ever-evolving nature. Some economic activity is informal or “underground” and difficult for the data to capture. Moreover, GDP is a “real” measure and separating activity into volumes and prices is often tricky, especially when there are significant improvements in a good’s quality. While statisticians are able to count some of the inputs into the calculation of GDP, most are estimated on the basis of surveys. That’s where the art comes in.
Many who analyze the Chinese economy distrust statisticians’ estimates and prefer to rely on “countables” as these data are less prone to manipulation. One well-known group of countables, the , combines the information in the kilowatt hours of electricity consumption, the tonnage of rail freight transportation and the CNY-value of bank loans.
Figure 1 presents the year-over-year growth of the Li Keqiang Index variables. I have replaced rail freight with the total tonnage of rail, water and air freight, as rail has become a relatively less important mode of shipping goods over time.
Figure 1
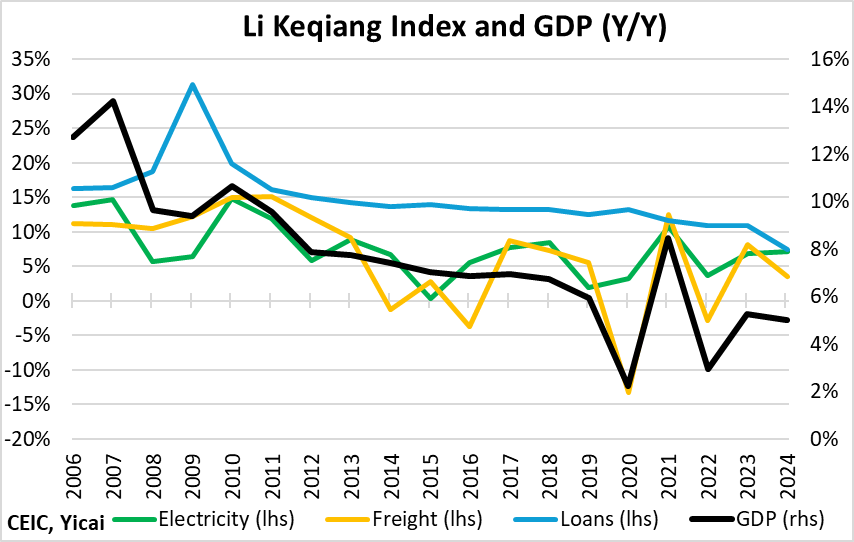
The Rhodium Group believes that the data released by China’s National Bureau of Statistics (NBS) seriously understates economic activity over the last three years. Rhodium says that, in 2024, “true” GDP growth was 2.2 to 2.6 percentage points below my 5 percent estimate. Moreover, in 2022 and 2023, it calculates that growth was -0.6 percent and 1.5 percent respectively. This compares to the NBS’s 3.0 and 5.2 percent.
What does the Li Keqiang Index say?
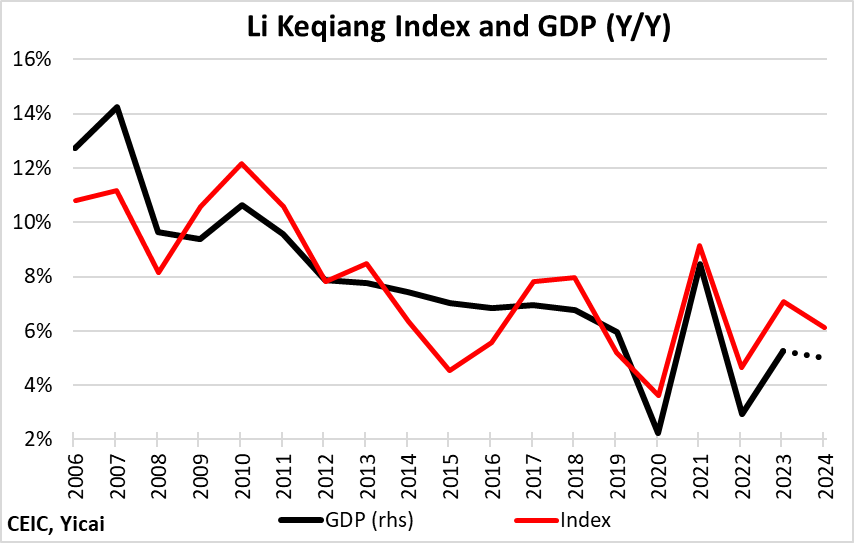
My version of the index picks up the broad trend in GDP, although it is more volatile (Figure 2). Importantly, while its growth has slowed in the last three years, the deceleration has not been dramatic. The Li Keqiang Index grew by 5.9 percent, on average, over 2022-24, compared to 6.6 percent between 2016 and 2019.
Since the pandemic, the NBS’s GDP estimates lie well below the Li Keqiang Index. This is because the Index does little to capture activity in the service sector, which was the most impacted by the disease and the public health measures.
Still, since the production of goods makes up a relatively large part of the Chinese economy and the Li Keqiang Index’s countables remained resilient, there does not seem to be strong evidence that the NBS has significantly over-stated growth.
Figure 2
To dig deeper into how fast the economy might have grown last year, I want to look at a handful of other countable indicators. None of these indicators is broad enough to fully capture GDP, but I believe the story they tell is consistent with the economy growing by close to 5 percent last year.
Whereas the Li Keqiang Index relies on freight transportation, Figure 3 presents the movement of people by both rail and air. I use a 12-month rolling sum to smooth away seasonality. After a sharp recovery from pandemic-impacted lows in 2023, both rail and air travel hit new highs in 2024. In the year through November 2024, rail travel rose by 13 percent while air travel was up 18 percent.
We don’t know where these people were going or if they travelled for business or pleasure. But we can be fairly sure that their trips are indicative of some sort of economic activity over and above their consumption of travel services.
Figure 3

If we focus in on tourism, the data show people were more willing to have fun last year.
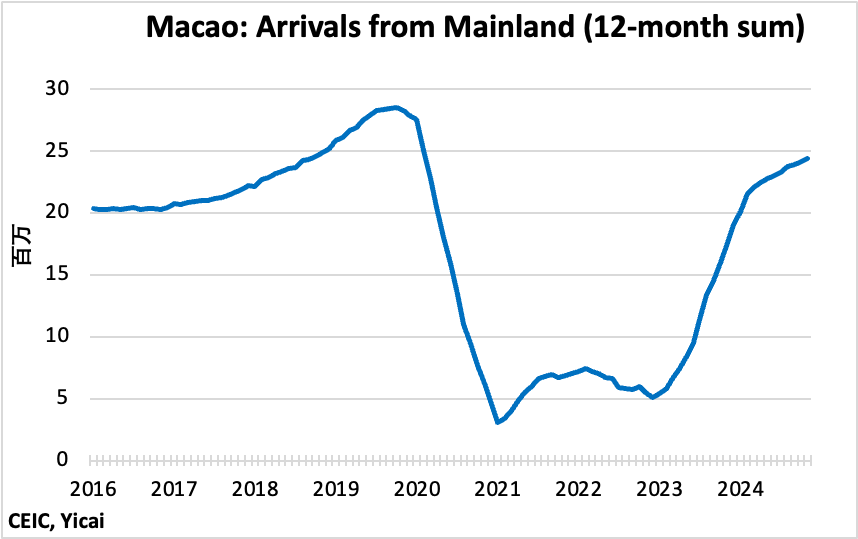
In the year-to-November 2024, 22 million Mainlanders travelled to Macao, a 31 percent increase from the same period in 2023 (Figure 4). Now, the Mainland’s national accounts consider the consumption of hotel services, restaurant meals and other entertainment in Macao as both consumption and imports. Thus, they have no overall impact on GDP. Nevertheless, I think it is fair to say that travel to Macao is a luxury. Clearly, going to Macao is different from travelling home for the Chinese New Year, which may be somewhat of an obligation. A strong increase in the import of luxury services indicates that people feel confident enough to engage in discretionary expenditure.
Figure 4
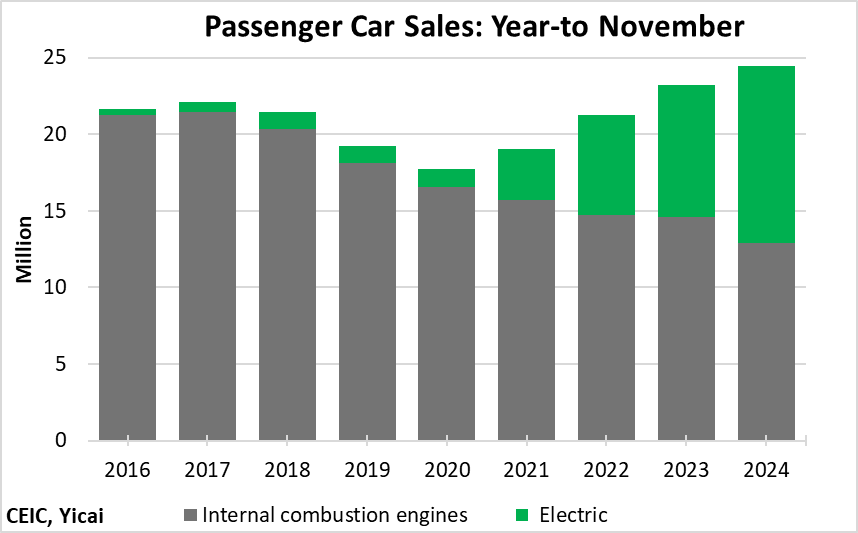
Perhaps a broader indicator of consumption is the sales of new passenger cars. In the year-to-November, a record 24 million passenger cars were sold. That’s a 5.2 percent increase from 2023 (Figure 5). Like discretionary travel, passenger car sales are a good indicator of consumer confidence because one can always drive that old clunker one more year.
Figure 5
International trade provides a very important source of countable data. That’s because all goods that enter and exit a country require customs documentation. In addition to noting the value of each shipment, customs officials record the quantity of items shipped. These value and quantity data allow statistical agencies to create fairly accurate aggregate volume measures.
In the year-to November, the value of Chinese exports was up 7 percent. But because export prices fell, the volume of exports rose by 13 percent (Figure 6). The volume of imports only rose by 2 percent. This, in part, reflects China’s ongoing movement up the value chain and its ability to produce inputs domestically that it previously had to import. It is also likely a symptom of the weakness in the property market. The construction of housing requires significant commodity imports.
Figure 6
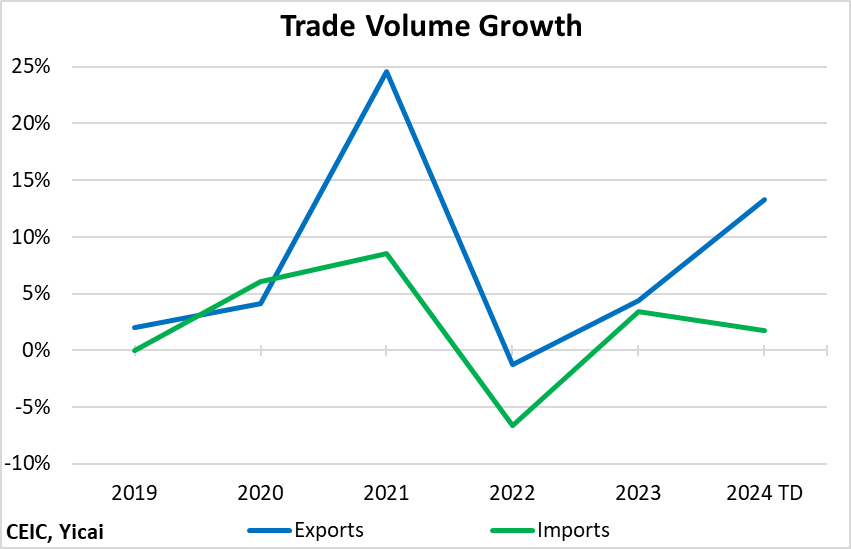
The property market exerted an even larger drag on the economy in 2024 than in previous years. Measured in terms of the year-over-year change in residential floor space under construction, the fall was close to 13 percent last year, the third consecutive year of decline (Figure 7).
While residential construction is a very important element of GDP, it is worth remembering that exports are probably twice as large on a value-added basis.
Figure 7
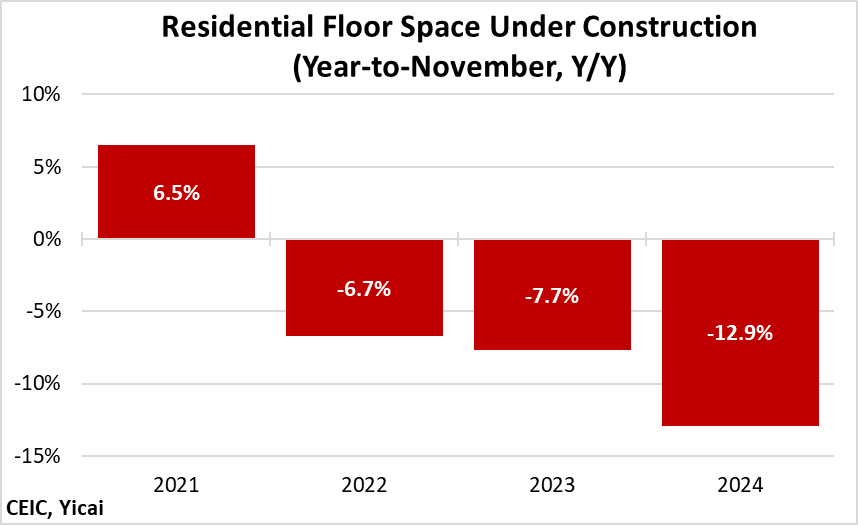
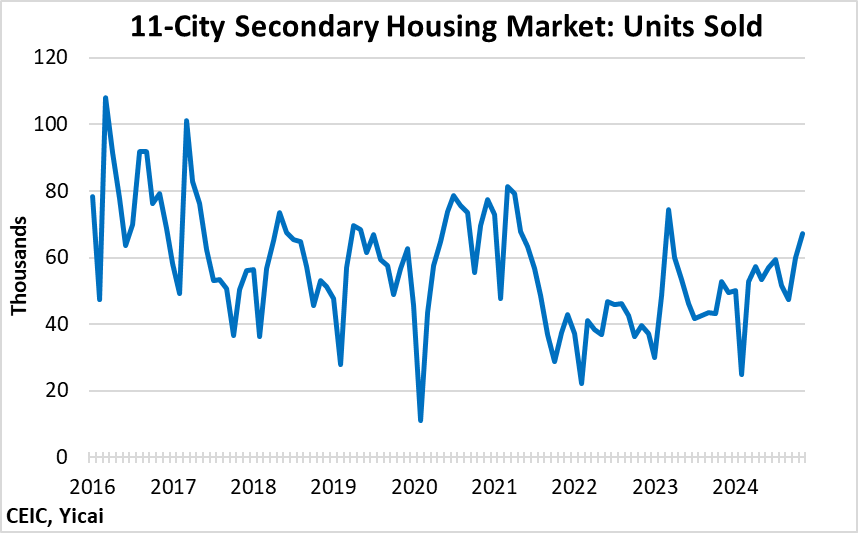
Given the property sector’s weakness, it may be surprising that the final indicator I want to present is the sale of existing homes in the secondary market. Figure 8 shows the number of units sold in the secondary housing market in 11 cities. While the level of sales remains well below their 2016 peak, the data do show an upward trend from mid-2022.
The secondary housing market does not contribute to GDP as much as the market for new homes. However, buying an existing home typically involves spending on renovation, decoration and appliances. Like the new car market, it is also an important indicator of household confidence.
Figure 8
I chose these 11 cities because, for each of them, I could find a consistent time series of sales data going back to 2016. I cannot be sure that these 11 cities are representative of the entire market. However, as Table 1 shows, the sample contains both large and small cities from locations across the country. For the 11 cities as a whole, secondary market sales are up 8 percent in the year-to-November 2024. There is, however, a lot of regional variation.
Table 1: Secondary Housing Market: Units Sold
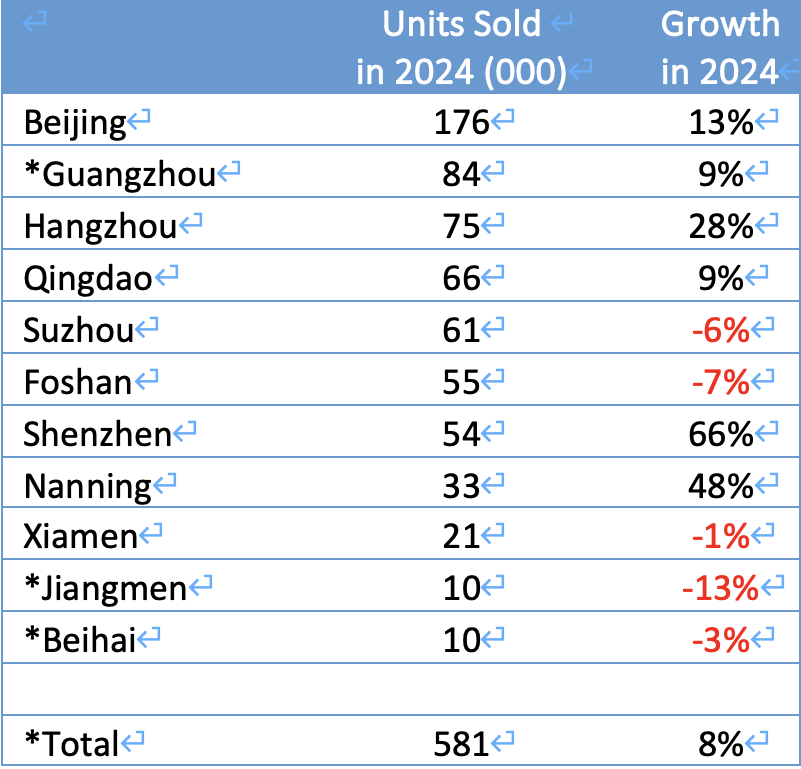
* Year-to-November.
I do not want to pretend that the indicators I have presented here are exhaustive. Nor have I been systematic. I have not tried to create an alternative GDP measure. I do not have the capacity to replicate the NBS’s work. Indeed, those that create alternative GDP indices face a daunting challenge – showing that their measure is objectively better than the NBS’s.
My goal has been more modest. I simply wanted to present a number of broad, countable indicators to show that 5 percent growth is not inconsistent with the range of information that we have.