 A Consumption-Led Recovery: 2023Q2 National Accounts Analysis
(Yicai Global) July 21 – While the data released by the National Bureau of Statistics (NBS) this week failed to meet expectations, I think it is hard to argue that the Chinese economy is in serious trouble. True, the property market has not yet recovered and foreign demand is weak, but it seems that the pieces are in place for a sustainable recovery.
The NBS reported that GDP grew by 6.3 percent year-over-year in the second quarter. This was below the 7 percent forecast by the Chief Economists surveyed by the Yicai Research Institute. Despite having April and May data to go by, the Chief Economists were highly uncertain as to how fast the economy might grow in the quarter. Their forecasts spanned a low of 5.8 to a high of 8.3 percent. This is an abnormally wide range. Their mean forecast for growth in 2019Q2 was 6.3 percent and the range was a narrow 6.1 to 6.4 percent.
Economic forecasting is a bit of a mug’s game. The point here is that a forecast error means a lot less in the context of high uncertainty.
GDP growth for the first half was 5.5 percent. Many economy watchers, I include myself among them, thought that with Covid behind us, the level of GDP would re-approach its pre-pandemic trend (Figure 1). However, in the second half, the economy appears to be some 7 percent below trend. In fact, it is about a percentage point farther away than in 2022H1.
Figure 1
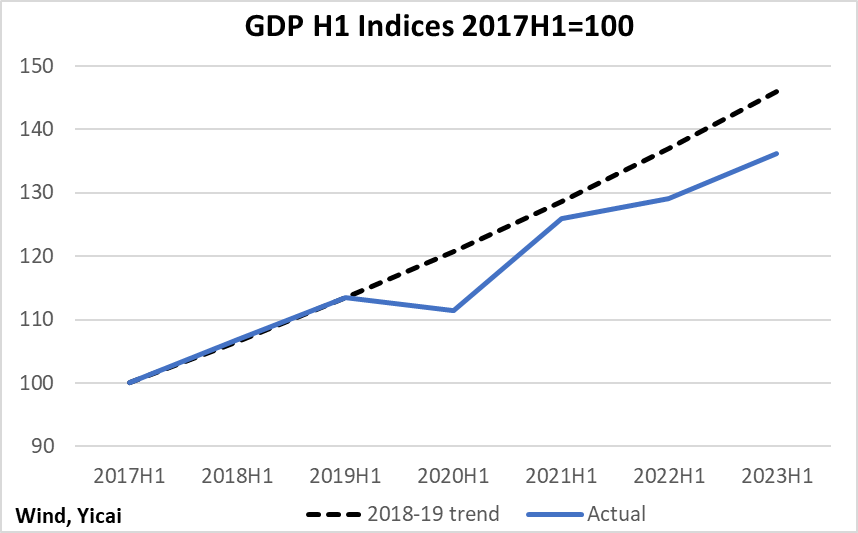
A low base – GDP growth in the first half of 2022 was only 2.5 percent – also created the expectation that a healthy economy should be growing even faster than the first half’s 5.5 percent. However, in setting its target for GDP growth at “around 5 percent”, the authorities signalled that a full recovery from the pandemic will take time and that they were not aiming to return GDP to its pre-pandemic level.
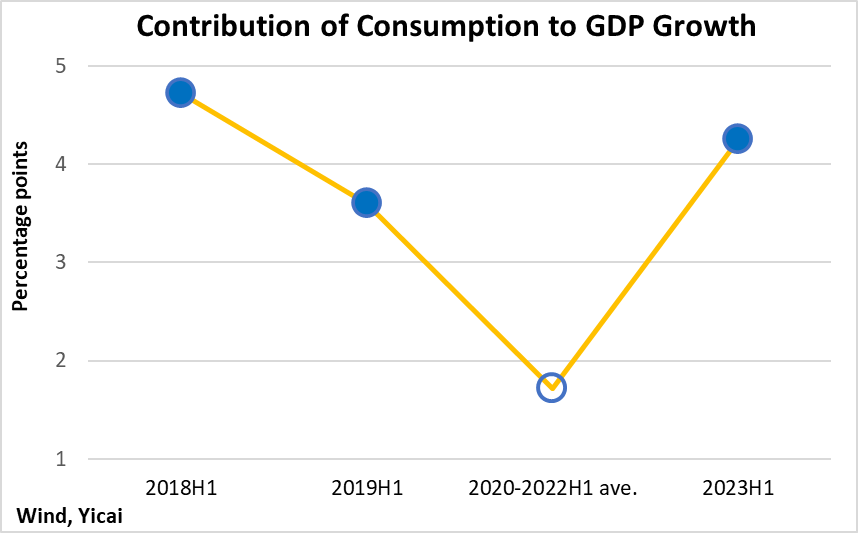
While the headline outcome was disappointing, the NBS’s report did contain a number of bright spots. Let’s start with consumption, which contributed 4.3 percentage points to growth in the first half. This was significantly higher than the 1.7 percentage points it contributed during the first halves of the previous three years, on average. It was in line with the contributions in 2018-19 (Figure 2).
Figure 2
Consumption is being underpinned by strong income growth and improved consumer confidence.
Real disposable household income rose by 5.8 percent in the first half, which was somewhat faster than GDP. Real household consumption expenditure rose even more rapidly, by 7.6 percent in the first half.
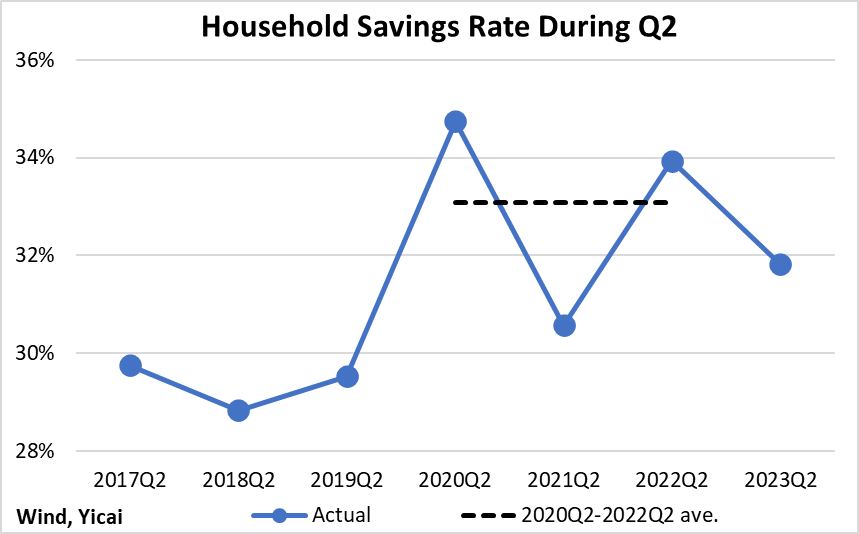
Spending growing more rapidly than incomes is a sign of renewed consumer confidence. Precautionary saving in the second quarter fell from its 2020-2022 average but it remains more elevated than pre-pandemic rates (Figure 3). This suggests that there is room for consumption to support the economy further in the near term.
Figure 3
NBS spokesman Fu Linghui noted that consumer spending on “contact” services such as wholesale and retail trade, accommodation and catering, and transportation have rebounded significantly so far this year.
His analysis is in line with my personal experience. Last month, we took the girls to Lushan, in Jiangxi Province, which has been a scenic getaway since the Tang Dynasty. The trains were sold out. The hotels were filled to capacity and the restaurants were crowded with merrymakers who were enjoying temperatures a good ten degrees cooler than those in Shanghai.
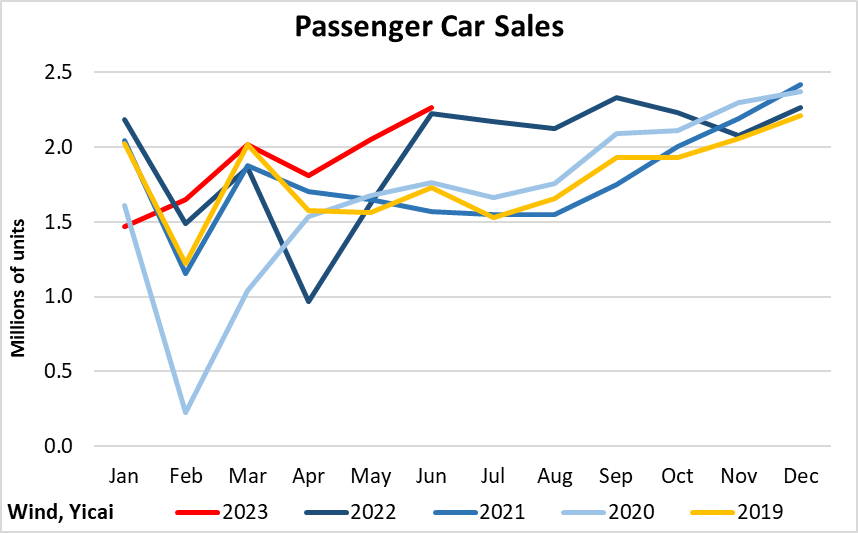
While consumer spending on goods was less buoyant than on services, the demand for passenger cars has remained strong. Unit sales were up 9 percent year-over-year in the first half and 11 percent higher than in 2019H1 (Figure 4). Strong sales of cars are typically a sign of buoyant consumer confidence: in uncertain times, families can make do with that old jalopy just a little bit longer
Figure 4
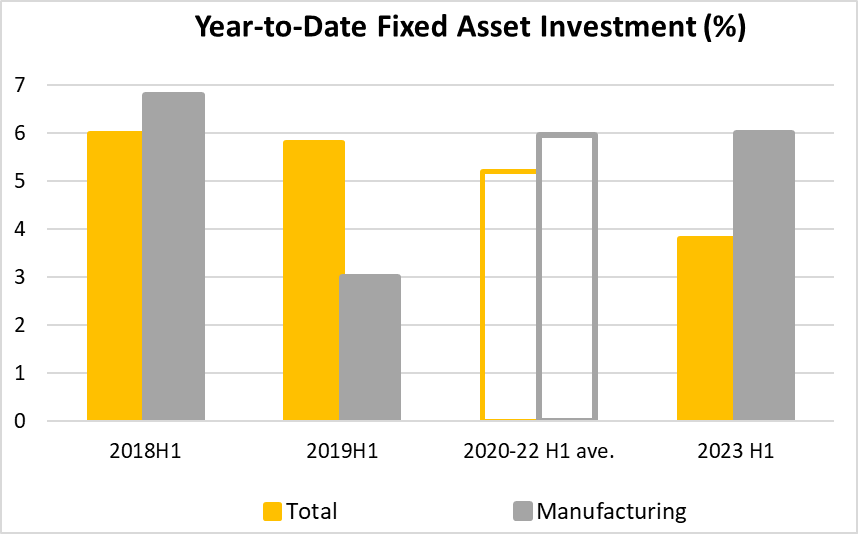
Turning to investment, the news was less good.
In nominal terms, the growth of fixed asset investment was only 3.8 percent, year-over-year, in the first half. This is well below both the average of 2020-2022 and the pre-pandemic period (Figure 5). The ongoing weakness in the property market continues to weigh on overall investment spending. Investment in real estate development fell by 7.9 percent in the first half, even more steeply than the 5.8 percent decline in the first quarter.
However, looking through the problems in the real estate sector, investment seems to be holding up pretty well. As Figure 5 shows, investment in manufacturing was up 6 percent in the first half, in line with its performance in previous years.
Infrastructure investment grew by 7.2 percent in the first half. According to Fu Linghui, spending on clean power was up 41 percent, with solar- and wind-power generation increasing by 84 and 16 percent respectively. He also noted that investment in new infrastructure – such as 5G, data centers, industrial Internet and smart transportation – was up 16 percent. Spending on rail and water management increased by 21 and 10 percent respectively.
Figure 5
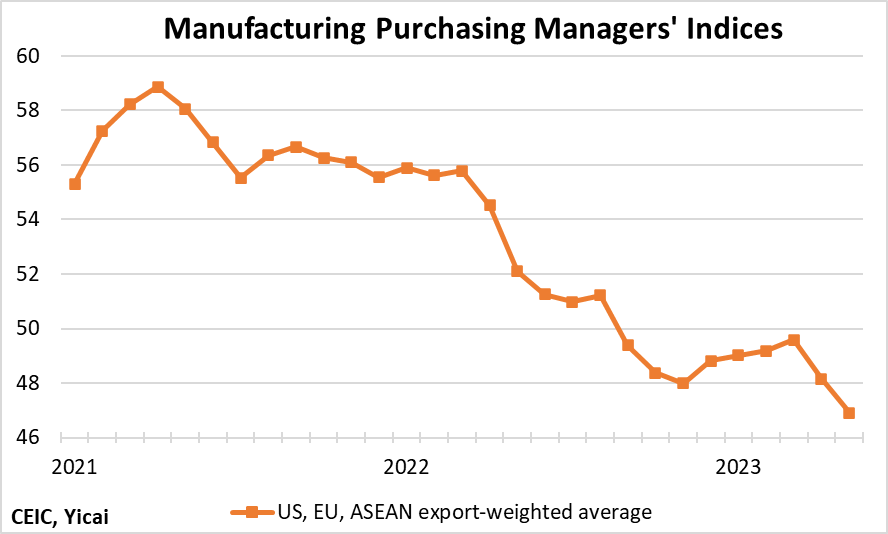
The growth of exports has fallen since late last year and the external sector has become a drag on the economy, subtracting 0.6 percentage points from growth in the first half. The purchasing managers’ indices for manufacturing, a high-frequency indicator of foreign demand, showed renewed weakness in May and June after a modest rebound earlier this year (Figure 6).
Figure 6
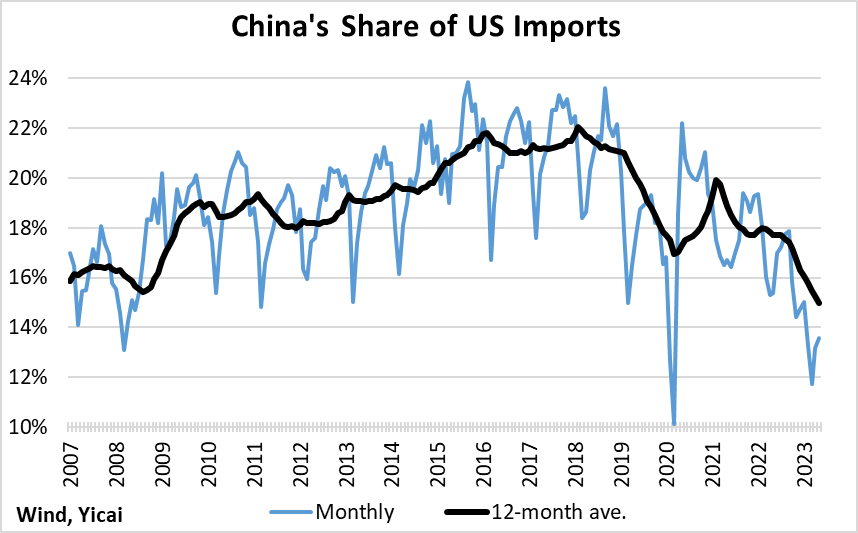
The poor performance of Chinese exports this year raises the concern of lost competitiveness in addition to weak foreign demand. To assess this, we look at the share of imports that come from China in the US and European Union markets.
Chinese exports have lost some market share in the US, which has maintained significant tariffs on Chinese goods since mid-2018. Over time, the effect of the tariffs on Chinese exports increases because US importers are better able to find alternatives. On average, over the last 12 months, imports from China accounted for 15 percent of all US imports, down from a peak of 22 percent in early 2018 (Figure 7).
Figure 7
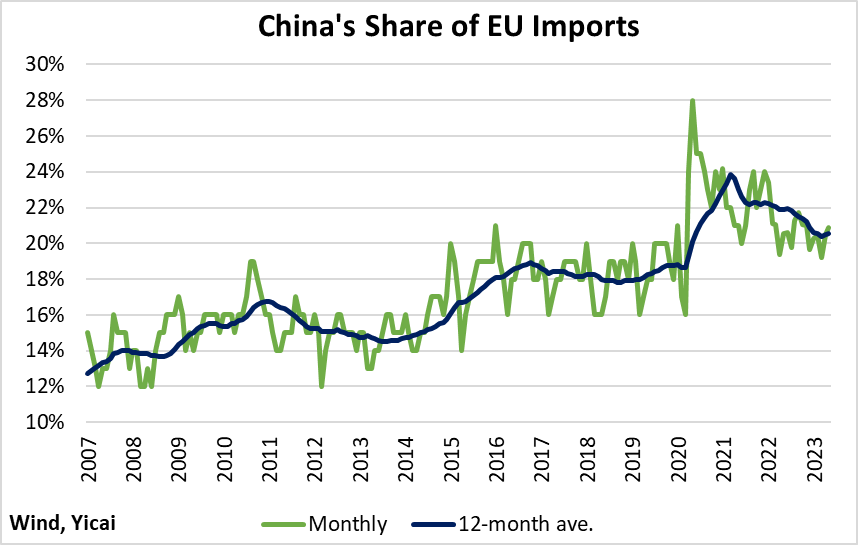
China’s experience in the European Union market, in which Chinese exporters do not face discriminatory tariffs, tells a somewhat different story (Figure 8). The share of imports purchased from China shot up in 2020, as its suppliers were much less affected by the pandemic than those in other countries. China’s import share has declined as production elsewhere came back on stream. But at 21 percent, it remains 2 percentage points higher than before the pandemic, suggesting that Chinese products continue to be competitive in this large, contestable market.
Figure 8
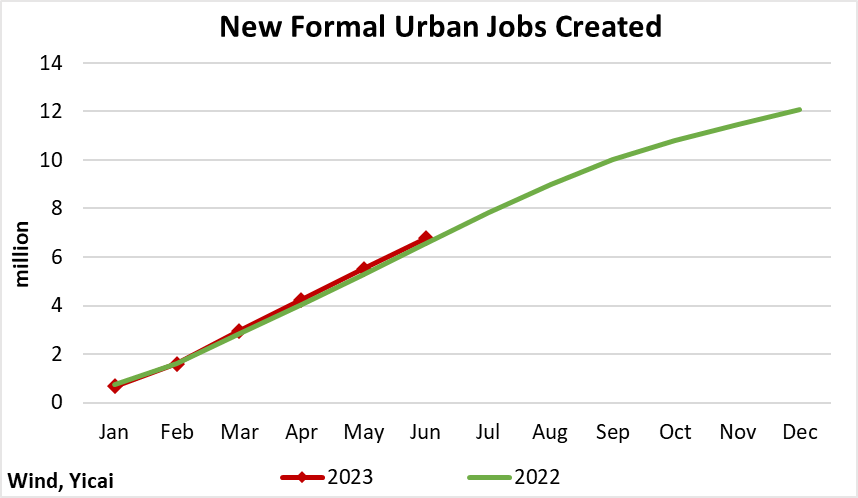
Despite the weaker-than-expected GDP growth, China’s labour market remains stable. According to Fu Linghui, the economy added 6.8 million new formal urban jobs in the first half of the year, 240,000 more than in 2022 (Figure 9). At this point, employment growth looks to be on pace to hit its target of 12 million new jobs for the year.
Figure 9
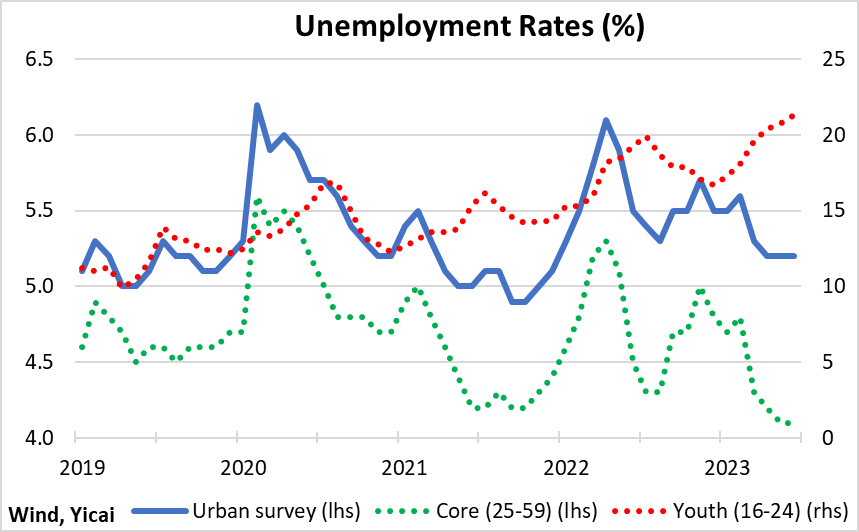
The urban survey unemployment rate has held steady at 5.2 percent, down from 5.5 percent in June 2022 (Figure 10). The unemployment rate for core workers aged 25-59 dipped to 4.1 percent, well below pre-pandemic levels.
Youth unemployment remains a problem. Fu Linghui noted that the unemployment rate for those aged 16-24 rose to 21.3 percent in June. With more students graduating and entering the labour market in the summer months, Fu said that the youth unemployment rate may rise further. He expects it to decline as young people gradually find jobs later this year.
Figure 10
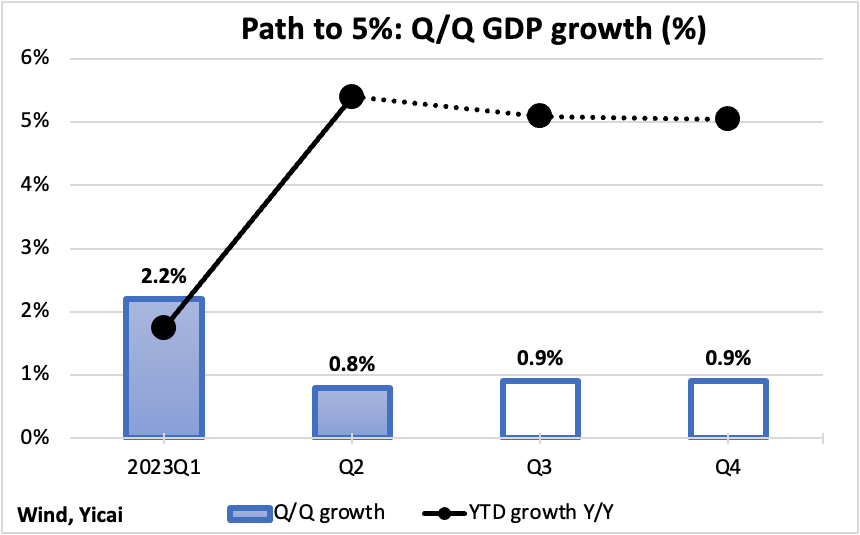
Notwithstanding the weaker than expected outturn in Q2, I believe the economy is on track to grow by 5 percent this year. Figure 11 depicts a possible path by which GDP growth achieves its target. The boxes indicate the quarter-over-quarter growth rates while the circles show the year-over-year, year-to-date rates. Over the next two quarters, the quarter-over-quarter increase needed is 0.9 percent, only marginally faster than the 0.8 percent recorded in Q2 and well below the 1.2 percent averaged over 2020Q1-2022Q4.
A statistical aside.
The American media did a disservice to its readers by emphasizing China’s 0.8 percent quarterly growth rate. This piece by the Wall Street Journal said that “China’s economy barely grew in the second quarter … .” Such reporting makes China’s growth seem slower than it actually was. When the media report on US GDP growth, the numbers are quoted at annual rates. The annualized growth rate is one plus the quarterly growth rate to the fourth power. Growth rates are annualized to make quarterly and annual comparisons easier. China’s 0.8 quarterly growth rate comes to 3.2 percent at annual rates. While this is below trend growth for China, it is incorrect to say its economy barely grew. Indeed, few large economies will end up growing this fast in Q2.
Figure 11
The annual GDP target is attainable at modest quarterly growth rates. As long as the labour market remains stable, I do not think that we will see much in the way of additional stimulus. I believe that policymakers are keen to rein in financial risks and that they will not feel compelled to push the economy too hard.
 Mark KrugerMark Kruger is Yicai Global's Opinion Editor and Senior fellow to the Yicai Research Institute. He is also a Senior Fellow at both the University of Alberta's China Institute and the Centre for International Governance Innovation. Mark was formerly a Senior Policy Director in the Bank of Canada's International Department, a Senior Advisor to the Canadian Executive Director at the International Monetary Fund and head of the Economic and Financial Section in the Canadian Embassy in Beijing.