China Securities Intelligent Financial News Fumiao Technology (688350) disclosed its 2024 annual report on April 3. In 2024, the company will achieve a total operating income of 1.566 billion yuan, a year-on-year decrease of 4.54%; The net profit loss attributable to the parent company was 4.6545 million yuan, compared with a profit of 27.2076 million yuan in the same period of last year, the non-net profit loss was 12.6053 million yuan, compared with a profit of 20.0357 million yuan in the same period of last year, and the net cash flow generated by operating activities was 117 million yuan, a year-on-year increase of 14.60%; During the reporting period, the basic earnings per share of Fumiao Technology was -0.04 yuan, and the weighted average return on equity was -0.32%.
During the reporting period, the company's total non-recurring profit and loss was 7.9508 million yuan, of which the government subsidy included in the current profit and loss was 6.0676 million yuan, in addition to the effective hedging business related to the company's normal business, the fair value change profit and loss arising from the holding of trading financial assets and trading financial liabilities, as well as the investment income obtained from the disposal of trading financial assets, trading financial liabilities and available-for-sale financial assets was 4.0858 million yuan, and the income tax impact was -1.4176 million yuan.

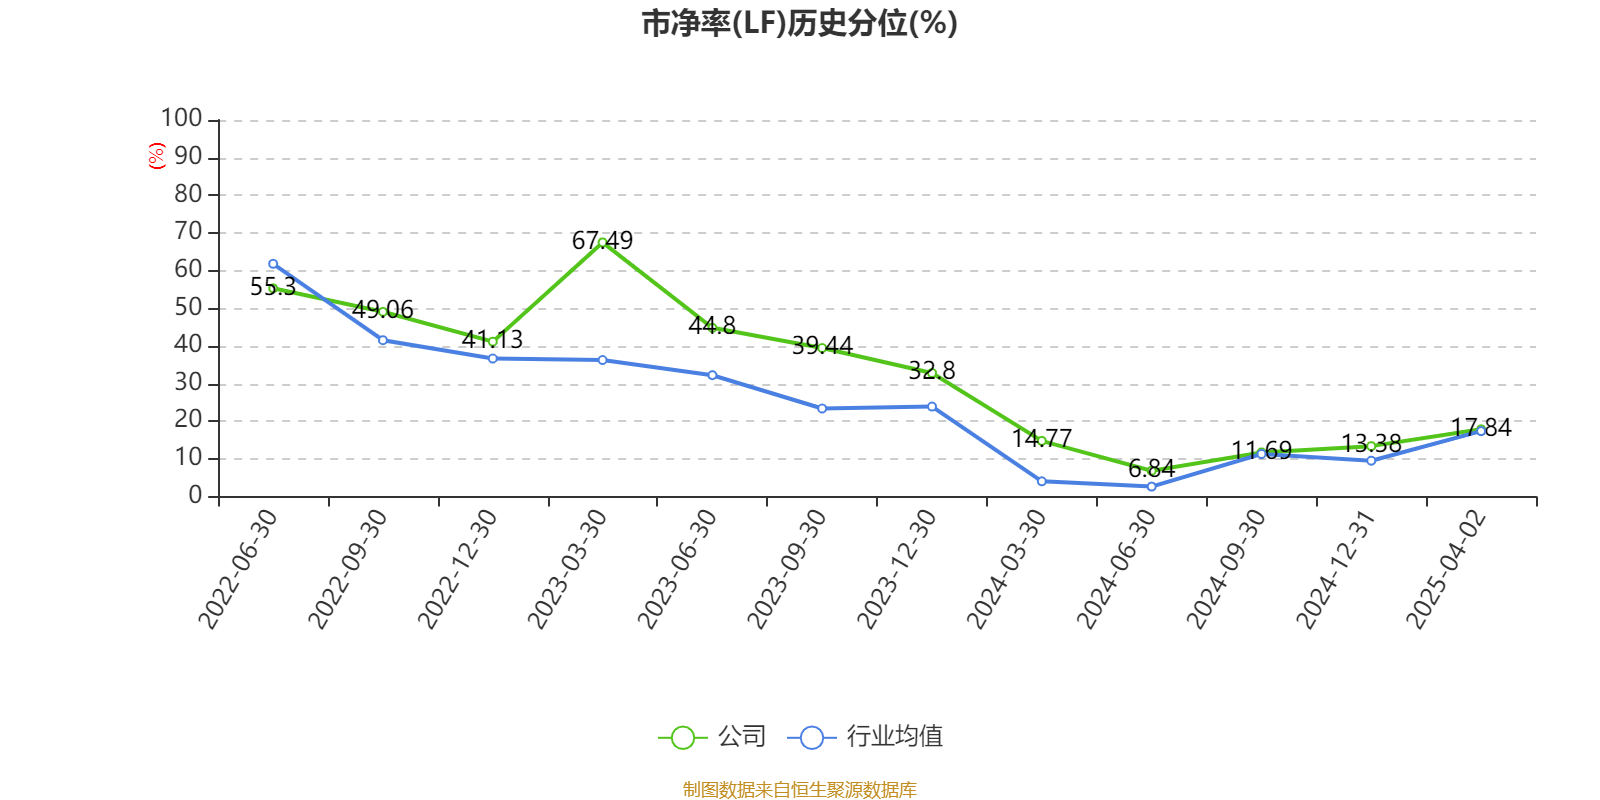
Based on the closing price on April 2, the current price-to-earnings ratio (TTM) of Fumiao Technology is about -357.96 times, the price-to-book ratio (LF) is about 1.18 times, and the price-to-sales ratio (TTM) is about 1.06 times.


According to the data, the company is engaged in the field of hydrophilic functional polymers in the fine chemical industry, providing water-soluble polymers, functional monomers, water treatment membranes and membrane applications and other products and services for domestic and foreign water-based industrial users such as pulp and paper, water treatment, oil and gas exploitation, mineral processing and textile printing and dyeing, creating core value for the green development of water-based industries and the protection of water ecology.


According to the data, the company's weighted average return on equity in 2024 will be -0.32%, down 2.13 percentage points from the same period last year. The company's return on invested capital in 2024 will be 0.62%, down 1.09 percentage points from the same period last year.


As of 2024, the company's net cash flow from operating activities will be 117 million yuan, a year-on-year increase of 14.6%; Net cash flow from financing activities was $158 million, an increase of $260 million year-on-year, and net cash flow from investment activities was -$126 million, compared to -$351 million in the same period last year.


In terms of major changes in assets, as of the end of 2024, the total trading financial assets of the company decreased by 67.89% from the end of the previous year, accounting for 7.94 percentage points of the company's total assets, the total number of projects under construction increased by 130.77% from the end of the previous year, accounting for 7.84 percentage points of the company's total assets, the notes receivable and accounts receivable decreased by 14.88% from the end of the previous year, accounting for 4.75 percentage points of the company's total assets, and the monetary funds increased by 47.47% from the end of the previous year. The proportion of the company's total assets increased by 4.64 percentage points.

In terms of major changes in liabilities, as of the end of 2024, the company's long-term borrowings increased by 2163.61% from the end of the previous year, accounting for 7.99 percentage points of the company's total assets, long-term deferred income increased by 172.63% from the end of the previous year, accounting for 0.96 percentage points of the company's total assets, contract liabilities decreased by 35.78% from the end of the previous year, accounting for 0.55 percentage points of the company's total assets, and notes payable and accounts payable increased by 12.09% from the end of the previous year. The proportion of the company's total assets increased by 0.47 percentage points.

From the perspective of inventory changes, as of the end of 2024, the book value of the company's inventory was 158 million yuan, accounting for 11.24% of net assets, an increase of 7.3298 million yuan from the end of the previous year. Among them, the provision for inventory decline was 15.8947 million yuan, and the provision ratio was 9.13%.


In 2024, the company's R&D investment will be 73.3415 million yuan, a year-on-year decrease of 4.95%; R&D investment accounted for 4.68% of operating income, down 0.02 percentage points from the same period last year. In addition, the capitalization rate of the company's R&D investment for the whole year was 0%.


In 2024, the company has a current ratio of 2.3 and a quick ratio of 2.02.


The annual report shows that among the top ten circulating shareholders of the company at the end of 2024, the new shareholder is Shenzhen Qianqianshuyun Technology Co., Ltd., replacing Zhao Shukai at the end of the third quarter. In terms of specific shareholding ratios, Beijing Ruishibang Fine Chemical Technology Co., Ltd., Zhangjiagang Enoch Juhuiyuan Investment Enterprise (Limited Partnership), and Zhang Haiyun's shareholding has declined.
| name | Number of outstanding shares held (10,000 shares) | to total share capital (%) | Change ratio (percentage points): |
|---|---|---|---|
| Jiangsu Feixiang Chemical Co., Ltd. | 5943.83 | 48.66 | unchanged |
| 2022 employee stock ownership plan | 329.7 | 2.6991 | unchanged |
| Beijing Ruishibang Fine Chemical Technology Co., Ltd. | 298.67 | 2.4451-0.564 | |
| Qian Wensheng | 246.85 | 2.0209 | unchanged |
| Jiang Haidong | 234.87 | 1.9227 | unchanged |
| Zhangjiagang Enoch Juhuiyuan Investment Enterprise (Limited Partnership) | 185.45 | 1.5182-0.413 | |
| Zhang Haiyun | 171.52 | 1.4041-0.012 | |
| Yu Yuming | 96.44 | 0.7894 | unchanged |
| Shenzhen Qianqianshuyun Technology Co., Ltd | .94.48 | 0.7734 | New |
| Liu Zhinian | 67.9 | 0.5558 | unchanged |

Indicator annotation:
P/E ratio = total market capitalization / net profit. When the company loses money, the P/E ratio is negative, and it is not practical to use the P/E ratio for valuation, and the P/B ratio or P/B ratio is often used as a reference.
Price-to-book ratio = total market capitalization / net assets. The price-to-book ratio valuation method is mostly used for companies with large fluctuations in earnings and relatively stable net assets.
Price-to-sales ratio = total market capitalization / operating income. The price-to-sales ratio method is often used for growing companies that are losing money or making small profits.
The price-to-earnings ratio and price-to-sales ratio in this article are calculated using the TTM method, that is, the data for the 12 months up to the latest financial report (including forecast). The price-to-book ratio is calculated using the LF method, that is, based on the latest financial report data. The quantile calculation range of the three is from the company's listing to the latest announcement date.
When the P/E ratio and price-to-book ratio are negative, the current quantile is not displayed, which will cause the line chart to be interrupted.
Ticker Name
Percentage Change
Inclusion Date