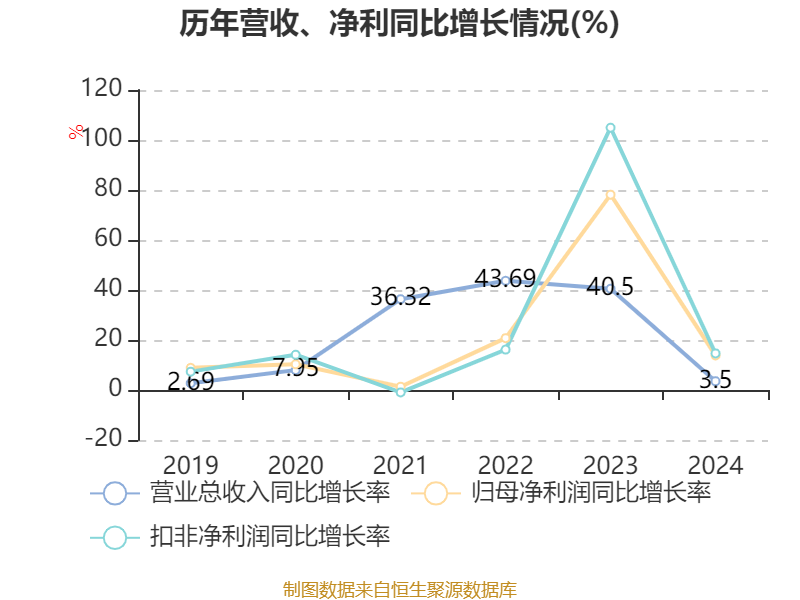
China Securities Intelligent Financial News Jinpan Technology (688676) disclosed its 2024 annual report on April 3. In 2024, the company will achieve a total operating income of 6.901 billion yuan, a year-on-year increase of 3.50%; net profit attributable to the parent company was 574 million yuan, a year-on-year increase of 13.82%; deducted non-net profit of 551 million yuan, a year-on-year increase of 14.64%; The net cash flow from operating activities was -36.9813 million yuan, compared with 205 million yuan in the same period last year, and the basic earnings per share of Jinpan Technology was 1.29 yuan, and the weighted average return on equity was 14.51% during the reporting period. The company's 2024 annual distribution plan is: it is planned to distribute 5.06 yuan (tax included) to all shareholders for every 10 shares.

Based on the closing price on April 2, the current price-to-earnings ratio (TTM) of Jinpan Technology is about 32.36 times, the price-to-book ratio (LF) is about 4.18 times, and the price-to-sales ratio (TTM) is about 2.69 times.


According to the data, the company is engaged in transformer series products, switchgear, box transformer series products, power electronic equipment series, energy storage series products, and overall solutions for digital factories.


According to the data, the company's weighted average return on equity in 2024 will be 14.51%, down 1.94 percentage points from the same period last year. The company's return on invested capital in 2024 will be 11.03%, down 0.78 percentage points from the same period last year.


As of 2024, the company's net cash flow from operating activities was -36.9813 million yuan, a year-on-year decrease of 242 million yuan, the net cash flow from financing activities was 243 million yuan, a year-on-year decrease of 3.3108 million yuan, and the net cash flow from investment activities was -438 million yuan, compared with -247 million yuan in the same period last year.


In terms of major changes in assets, as of the end of 2024, the company's contract assets accounted for 5.72% of the company's total assets, compared with 0 at the end of the previous year; Monetary funds decreased by 29.28% from the end of the previous year, accounting for 3.46 percentage points of the company's total assets, notes receivable and accounts receivable increased by 2.03% from the end of the previous year, accounting for 3.37 percentage points of the company's total assets, and fixed assets decreased by 4.07% from the end of the previous year, accounting for 3.2 percentage points of the company's total assets.

In terms of major changes in liabilities, as of the end of 2024, the company's bonds payable decreased by 100% from the end of the previous year, accounting for 9.81 percentage points of the company's total assets, long-term borrowings increased by 63.43% from the end of the previous year, accounting for 2.75 percentage points of the company's total assets, notes payable and accounts payable increased by 4.87% from the end of the previous year, accounting for 1.96 percentage points of the company's total assets, and short-term borrowings increased by 206.58% from the end of the previous year. The proportion of the company's total assets increased by 1.11 percentage points.

From the perspective of inventory changes, as of the end of 2024, the book value of the company's inventory was 2.119 billion yuan, accounting for 47.63% of net assets, an increase of 384 million yuan from the end of the previous year. Among them, the provision for inventory decline was 19.1776 million yuan, and the provision ratio was 0.9%.


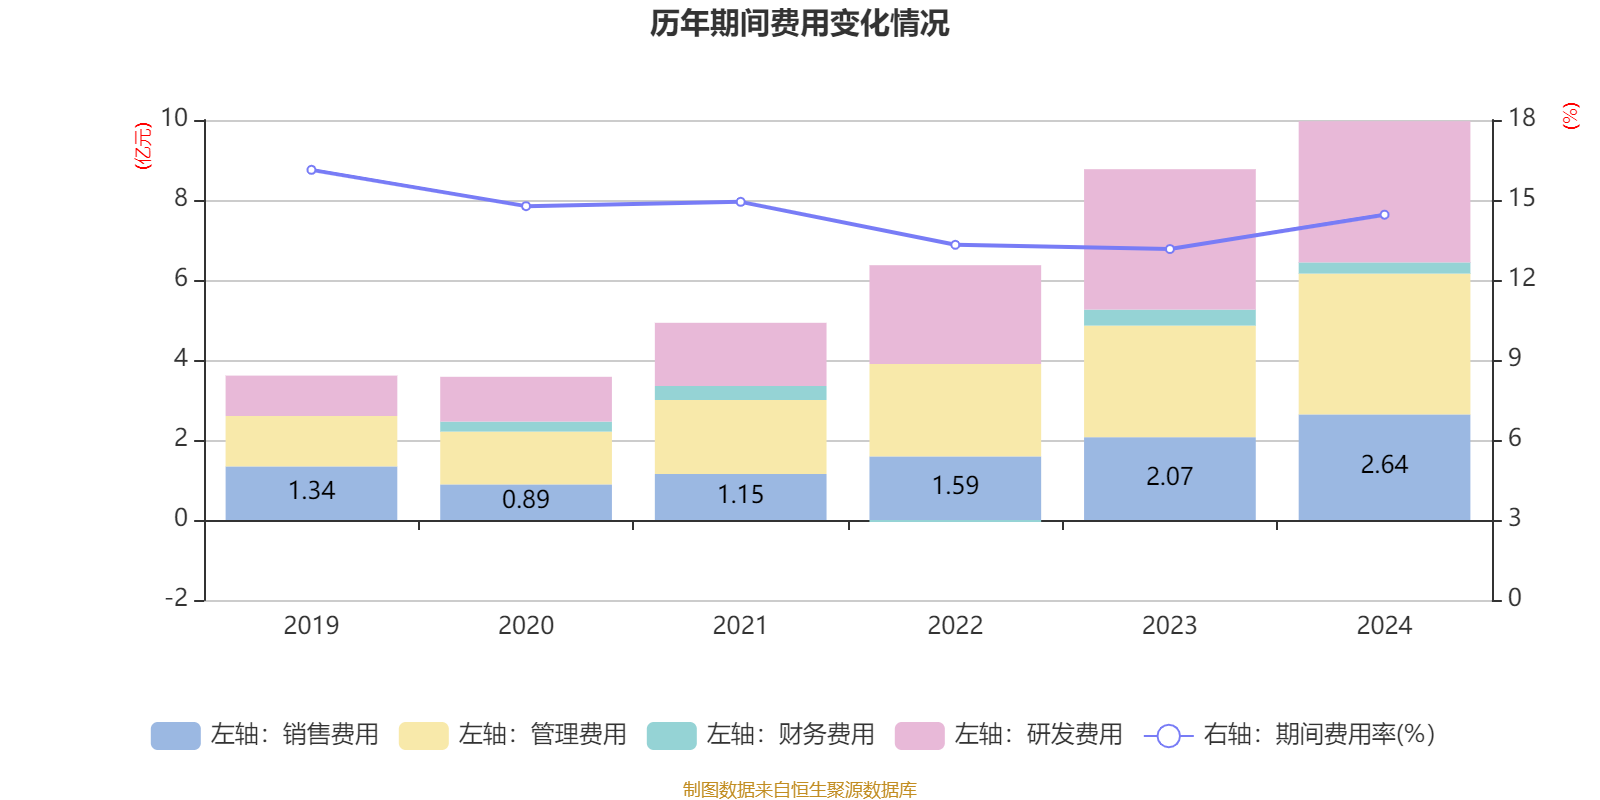
In 2024, the company's R&D investment will be 356 million yuan, a year-on-year increase of 1.3%; R&D investment accounted for 5.15% of operating income, down 0.12 percentage points from the same period last year. In addition, the capitalization rate of the company's R&D investment for the year was 0.79%.


In 2024, the company has a current ratio of 1.73 and a quick ratio of 1.21.


According to the annual report, among the top ten circulating shareholders of the company at the end of 2024, the new shareholder is Caitong Growth Preferred Hybrid Securities Investment Fund, which replaces the traditional single asset management plan of Wells Fargo Fund China Life Growth Stock at the end of the third quarter. In terms of specific shareholding ratios, the holdings of Hong Kong Securities Clearing Co., Ltd. and Caitong Value Momentum Hybrid Securities Investment Fund have increased, and JINPAN INTERNATIONAL LIMITED, Forebright Smart Connection Technology Limited, Wangpeng (Hainan) Investment Partnership (Limited Partnership), Junhang (Hainan) Investment Partnership (Limited Partnership), Chunrong (Hainan) Investment Partnership ( Limited partnership) holdings declined.
| name | Number of outstanding shares held (10,000 shares) | to total share capital (%) | , change ratio (percentage points): |
|---|---|---|---|
| Hainan Yuanyu Intelligent Technology Investment Co., Ltd. | 18486.42 | 40.4126 | unchanged |
| Jingtian (Hainan) Investment Partnership (Limited Partnership). | 2230 | 4.8749 | unchanged |
| JINPAN INTERNATIONAL | LIMITED 1417.19 | 3.098-2.797 | |
| Forebright Smart Connection Technology Limited | 1212.85 | 2.6513-0.999 | |
| Hong Kong Securities Clearing Co., Ltd | .1045.24 | 2.2849 | 1.056 |
| Wangpeng (Hainan) Investment Partnership(Limited Partnership). | 571.95 | 1.2503-0.005 | |
| Caitong Value Momentum Hybrid Securities Investment Fund | 503.69 | 1.101 | 0.060 |
| Junhang (Hainan) Investment Partnership (Limited Partnership) | 499.85 | 1.0927-0.052 | |
| Caitong Growth Preferred Mixed Securities Investment Fund | 479.1 | 1.0473 | Xinjin |
| Chunrong (Hainan) Investment Partnership (Limited Partnership) | 452.96 | 0.9902-0.028 |

Proofreading: Yang Ning
Indicator Annotation:
P/E ratio = total market capitalization / net profit. When the company loses money, the P/E ratio is negative, and it is not practical to use the P/E ratio for valuation, and the P/B ratio or P/B ratio is often used as a reference.
Price-to-book ratio = total market capitalization / net assets. The price-to-book ratio valuation method is mostly used for companies with large fluctuations in earnings and relatively stable net assets.
Price-to-sales ratio = total market capitalization / operating income. The price-to-sales ratio method is often used for growing companies that are losing money or making small profits.
The price-to-earnings ratio and price-to-sales ratio in this article are calculated using the TTM method, that is, the data for the 12 months up to the latest financial report (including forecast). The price-to-book ratio is calculated using the LF method, that is, based on the latest financial report data. The quantile calculation range of the three is from the company's listing to the latest announcement date.
When the P/E ratio and price-to-book ratio are negative, the current quantile is not displayed, which will cause the line chart to be interrupted.
Ticker Name
Percentage Change
Inclusion Date