China Securities Intelligent Financial News Times Electric (688187) disclosed its 2024 annual report on March 29. In 2024, the company will achieve a total operating income of 24.909 billion yuan, a year-on-year increase of 13.42%; the net profit attributable to the parent company was 3.703 billion yuan, a year-on-year increase of 21.77%; deducted non-net profit of 3.226 billion yuan, a year-on-year increase of 24.28%; the net cash flow from operating activities was 3.361 billion yuan, a year-on-year increase of 21.45%; During the reporting period, Times Electric's basic earnings per share was 2.62 yuan, and the weighted average return on equity was 9.31%. The company's 2024 annual distribution plan is: it intends to distribute 10 yuan (tax included) to all shareholders for every 10 shares.

Based on the closing price on March 28, Times Electric's current price-to-earnings ratio (TTM) is about 17.7 times, the price-to-book ratio (LF) is about 1.58 times, and the price-to-sales ratio (TTM) is about 2.63 times.


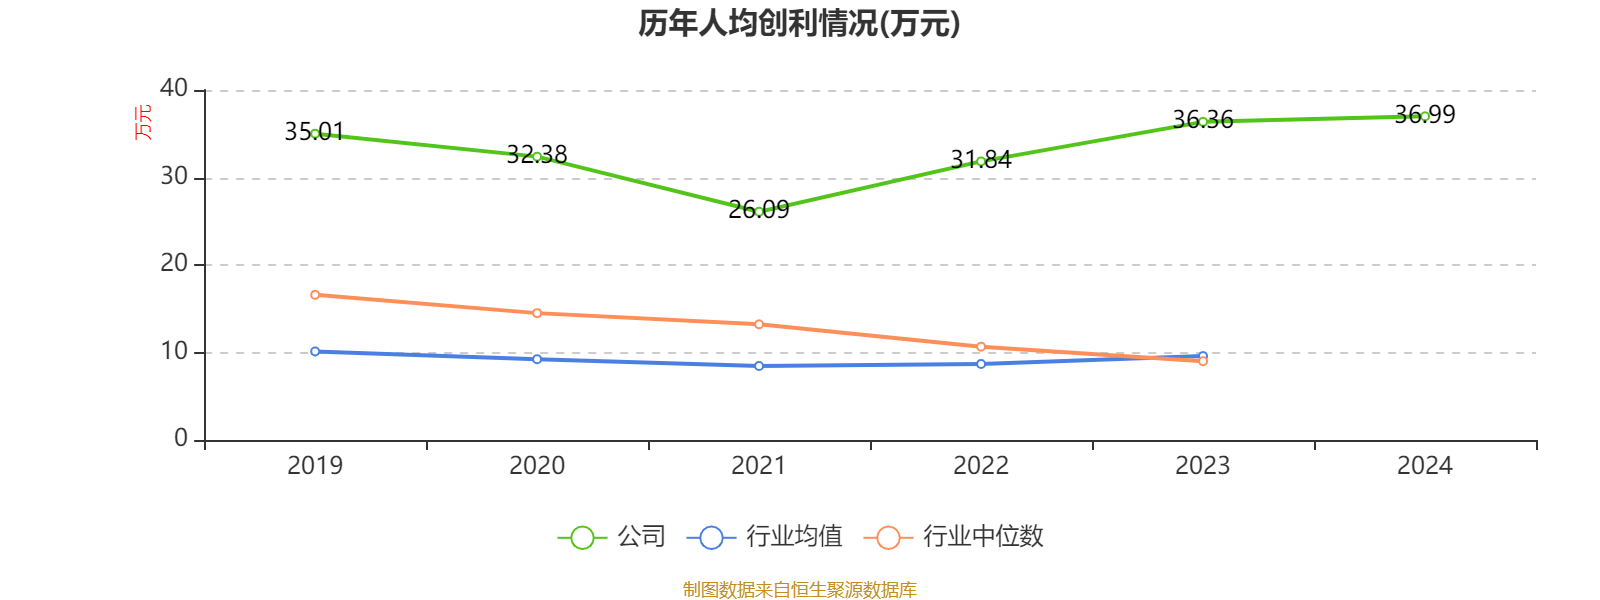
According to the data, the company's main business is rail transit electrical equipment, rail construction machinery, communication signal systems, power semiconductor devices, etc.


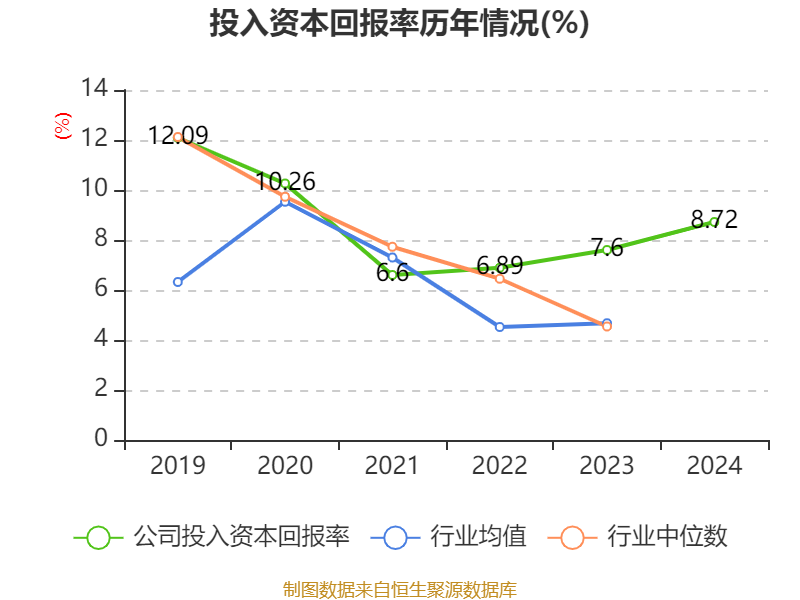
According to the data, the company's weighted average return on equity in 2024 will be 9.31%, an increase of 0.83 percentage points from the same period last year. The company's return on invested capital in 2024 will be 8.72%, an increase of 1.12 percentage points from the same period last year.

As of 2024, the company's net cash flow from operating activities will be 3.361 billion yuan, a year-on-year increase of 21.45%; Net cash flow from financing activities was RMB456 million, an increase of RMB1.027 billion year-on-year, and net cash flow from investing activities was RMB3.2 billion, compared to RMB2.279 billion in the same period last year.


In terms of major changes in assets, as of the end of 2024, the company's other non-current assets decreased by 37.29% from the end of the previous year, accounting for 5 percentage points of the company's total assets; The total trading financial assets decreased by 26.01% from the end of the previous year, accounting for 3.43 percentage points of the company's total assets, fixed assets increased by 62.26% from the end of the previous year, accounting for 3.41 percentage points of the company's total assets, and receivables financing decreased by 15.74% from the end of the previous year, accounting for 2.54 percentage points of the company's total assets.

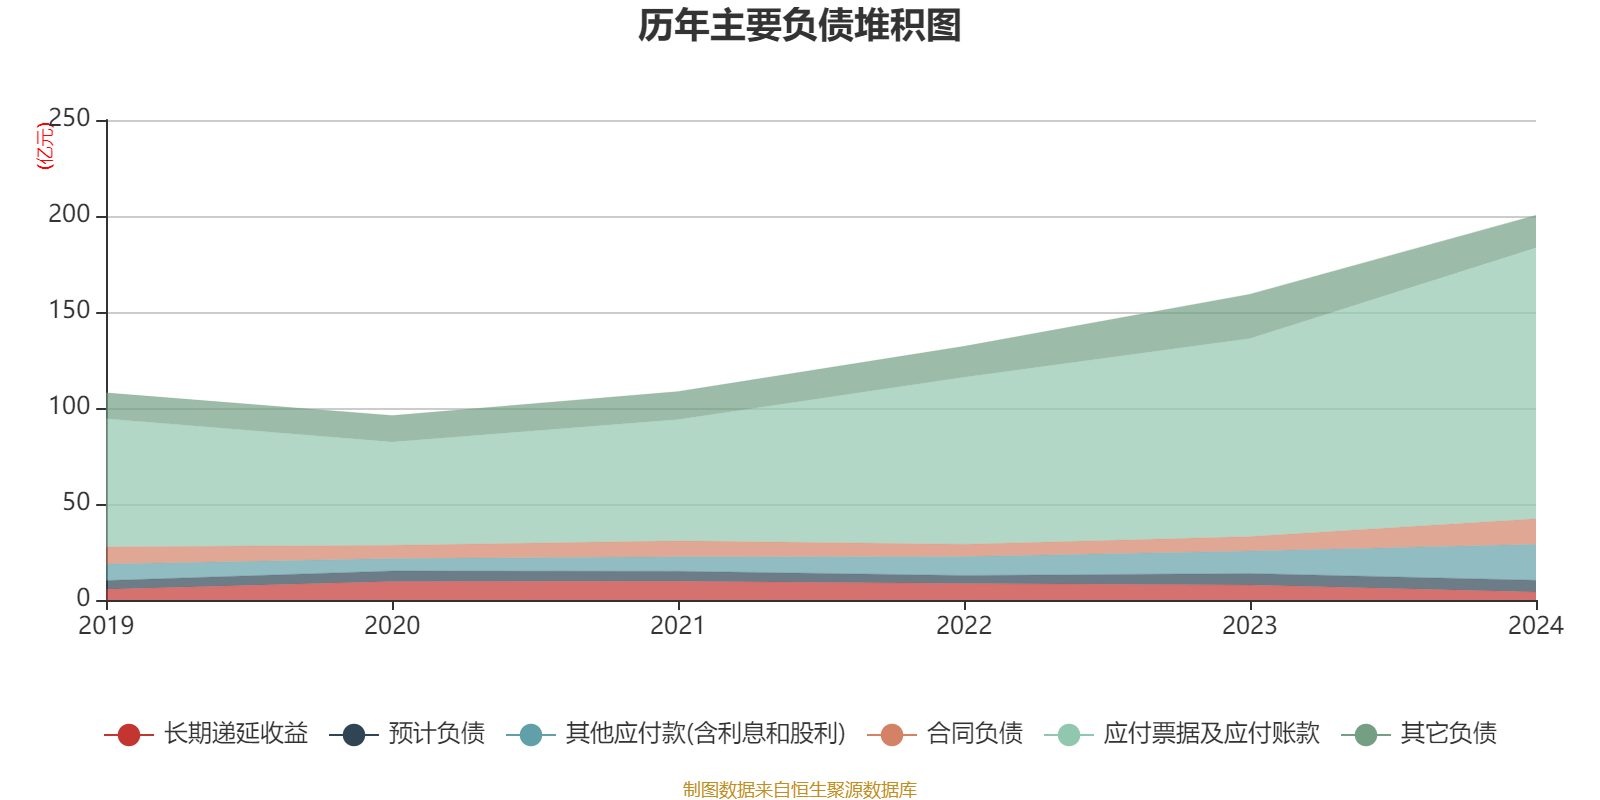
In terms of major changes in liabilities, as of the end of 2024, the company's notes payable and accounts payable increased by 36.64% from the end of the previous year, accounting for 2.57 percentage points of the company's total assets, long-term borrowings decreased by 90.19% from the end of the previous year, accounting for 1.08 percentage points of the company's total assets, long-term deferred income decreased by 46% from the end of the previous year, accounting for 0.8 percentage points of the company's total assets, and short-term borrowings decreased by 90.6% from the end of the previous year. The proportion of the company's total assets decreased by 0.71 percentage points.
From the perspective of inventory changes, as of the end of 2024, the book value of the company's inventory was 7.064 billion yuan, accounting for 17.01% of net assets, an increase of 1.621 billion yuan from the end of the previous year. Among them, the provision for inventory decline was 271 million yuan, and the provision ratio was 3.7%.


In 2024, the company's R&D investment will be 2.842 billion yuan, a year-on-year increase of 29.95%; R&D investment accounted for 11.41% of operating income, an increase of 1.45 percentage points over the same period last year. In addition, the capitalization rate of the company's R&D investment for the year was 6.52%.


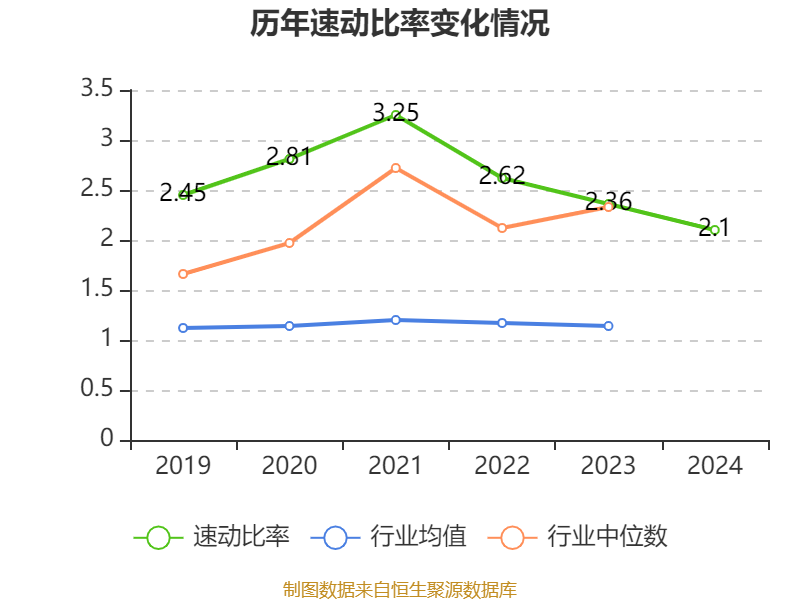
In 2024, the company has a current ratio of 2.48 and a quick ratio of 2.1.

According to the annual report, among the top ten circulating shareholders of the company at the end of 2024, the new shareholder is CRRC Zhuzhou Electric Locomotive Research Institute Co., Ltd. In terms of specific shareholding ratios, Hong Kong Securities Clearing Co., Ltd., CRRC Zhuzhou Electric Locomotive Co., Ltd., China Railway Construction High-tech Equipment Co., Ltd., National Social Security Fund 110 Portfolio, Huatai Pinebridge CSI 300 Exchange-traded Open-ended Index Securities Investment Fund, Hunan Rail Transit Holding Group Co., Ltd., Guohua Investment and Development Asset Management (Beijing) Co., Ltd. have increased their shareholdings, and HKSCC NOMINEES LIMITED, ChinaAMC's SSE STAR Market 50 Component Exchange-traded Open-ended Index Securities Investment Fund and E Fund's SSE STAR Market 50 Component Exchange-traded Open-ended Index Securities Investment Fund saw a decline in their holdings.
| shareholder name | number of shares outstanding(10,000 shares). | Proportion of total share capital (%) | change ratio (percentage points) |
|---|---|---|---|
| HKSCC NOMINEES LIMITED | 53642.37 | 38.1347-0.214 | |
| Hong Kong Securities Clearing Company Limited | 2501.26 | 1.7781 | 0.155 |
| ChinaAMC SSE STAR Market 50 Component Exchange-traded Open-ended Index Securities Investment Fund | 1771.08 | 1.259-0.244 | |
| E Fund SSE STAR Market 50 Component ETF | 1091 | 0.7756-0.097 | |
| CRRC Zhuzhou Electric Locomotive Research Institute Co., Ltd. | 1079.58 | 0.7674 | New |
| CRRC Zhuzhou Electric Locomotive Co., Ltd | .1000 | 0.7109 | 0.002 |
| China Railway Construction High-tech Equipment Co., Ltd | . 980 | 0.6966 | 0.002 |
| National Social Security Fund 110 Portfolio | 588.5 | 0.4183 | 0.123 |
| Huatai Berry CSI 300 Exchange-traded Open-ended Index Securities Investment Fund | 462.79 | 0.329 | 0.002 |
| Hunan Rail Transit Holding Group Co., Ltd | .395.89 | 0.2814 | 0.001 |
| Guohua Investment & Development Asset Management (Beijing) Co., Ltd | 395.89 | 0.2814 | 0.001 |

Proofreading: Sun Ping
Indicator Annotation:
P/E ratio = total market capitalization / net profit. When the company loses money, the P/E ratio is negative, and it is not practical to use the P/E ratio for valuation, and the P/B ratio or P/B ratio is often used as a reference.
Price-to-book ratio = total market capitalization / net assets. The price-to-book ratio valuation method is mostly used for companies with large fluctuations in earnings and relatively stable net assets.
Price-to-sales ratio = total market capitalization / operating income. The price-to-sales ratio method is often used for growing companies that are losing money or making small profits.
The price-to-earnings ratio and price-to-sales ratio in this article are calculated using the TTM method, that is, the data for the 12 months up to the latest financial report (including forecast). The price-to-book ratio is calculated using the LF method, that is, based on the latest financial report data. The quantile calculation range of the three is from the company's listing to the latest announcement date.
When the P/E ratio and price-to-book ratio are negative, the current quantile is not displayed, which will cause the line chart to be interrupted.
Ticker Name
Percentage Change
Inclusion Date