China Securities Intelligent Financial News, SMIC (688981) disclosed its 2024 annual report on March 28. In 2024, the company will achieve a total operating income of 57.796 billion yuan, a year-on-year increase of 27.72%; the net profit attributable to the parent company was 3.699 billion yuan, a year-on-year decrease of 23.31%; deducted non-net profit of 2.645 billion yuan, a year-on-year decrease of 19.09%; the net cash flow from operating activities was 22.659 billion yuan, down 1.69% year-on-year; During the reporting period, SMIC's basic earnings per share was 0.46 yuan, and the weighted average return on equity was 2.50%.

Based on the closing price on March 27, SMIC's current price-to-earnings ratio (TTM) is about 199.54x, the price-to-book ratio (LF) is about 4.98x, and the price-to-sales ratio (TTM) is about 12.77x.


According to the data, the company's main integrated circuit wafers.


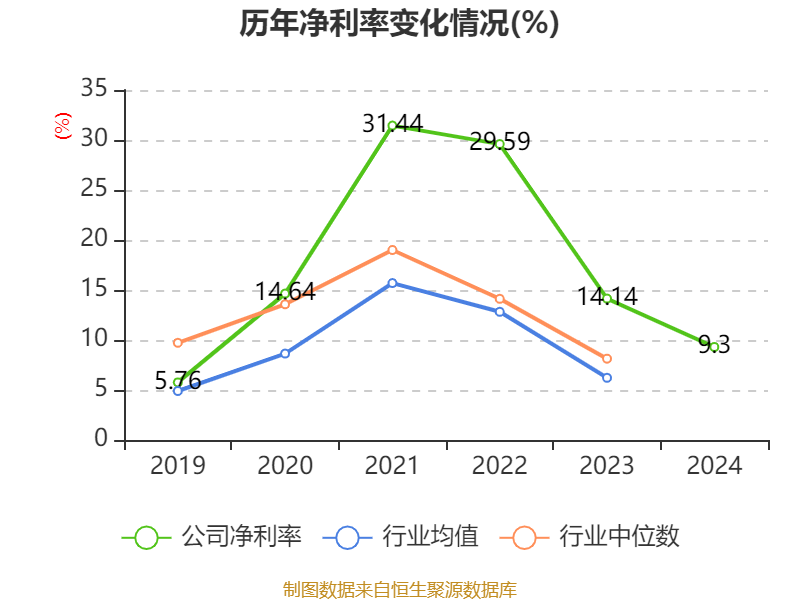


According to the data, the company's weighted average return on equity in 2024 will be 2.5%, down 1 percentage point from the same period last year. The company's return on invested capital in 2024 will be 1.28%, an increase of 0.22 percentage points from the same period last year.


As of 2024, the company's net cash flow from operating activities will be 22.659 billion yuan, a year-on-year decrease of 1.69%; The net cash flow from financing activities was 9.999 billion yuan, a decrease of 5.729 billion yuan year-on-year, and the net cash flow from investment activities was -30.669 billion yuan, compared with -41.701 billion yuan in the same period last year.


In terms of major changes in assets, as of the end of 2024, the company's other non-current assets decreased by 41.59% from the end of the previous year, accounting for 6.6 percentage points of the company's total assets, fixed assets increased by 22.84% from the end of the previous year, accounting for 4.82 percentage points of the company's total assets, non-current assets due within one year increased by 84.89% from the end of the previous year, accounting for 3.44 percentage points of the company's total assets, and the total number of projects under construction increased by 14.64% from the end of the previous year. The proportion of the company's total assets increased by 2.23 percentage points.

In terms of major changes in liabilities, as of the end of 2024, the company's contractual liabilities decreased by 41.36% from the end of the previous year, accounting for 1.9 percentage points of the company's total assets, bonds payable decreased by 100% from the end of the previous year, accounting for 1.25 percentage points of the company's total assets, long-term borrowings decreased by 2.11% from the end of the previous year, accounting for 1.09 percentage points of the company's total assets, and other payables (including interest and dividends) decreased by 14.17% from the end of the previous year. The proportion of the company's total assets decreased by 1.06 percentage points.

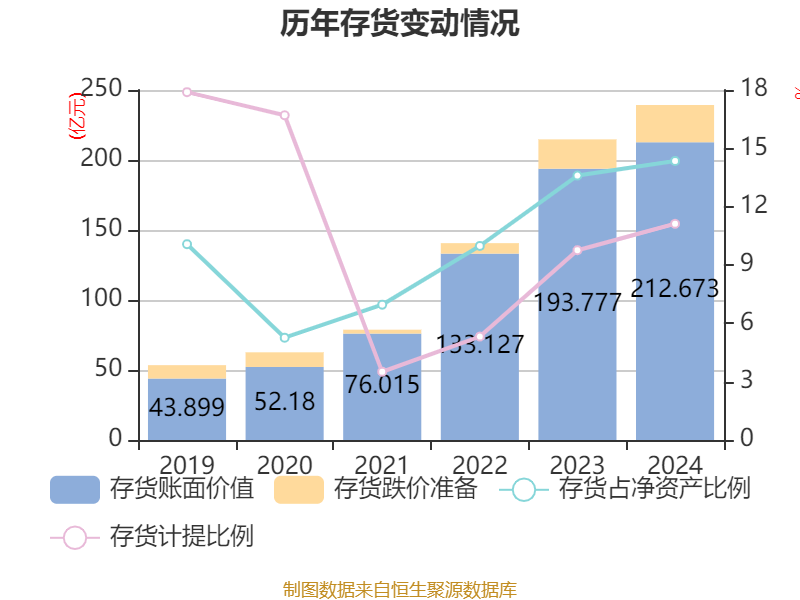
From the perspective of inventory changes, as of the end of 2024, the book value of the company's inventory was 21.267 billion yuan, accounting for 14.35% of net assets, an increase of 1.89 billion yuan from the end of the previous year. Among them, the provision for inventory decline was 2.661 billion yuan, and the provision ratio was 11.12%.

In 2024, the company's R&D investment will be 5.447 billion yuan, a year-on-year increase of 9.13%; R&D investment accounted for 9.4% of operating income, down 1.6 percentage points from the same period last year.


In 2024, the company has a current ratio of 1.73 and a quick ratio of 1.38.


According to the annual report, among the top ten circulating shareholders of the company at the end of 2024, the new shareholder is Huatai Pinebridge CSI 300 Exchange-traded Open-ended Index Securities Investment Fund, which replaced the ChinaAMC Guoxi Semiconductor Chip Exchange-traded Open-ended Index Securities Investment Fund at the end of the third quarter. In terms of specific shareholding ratios, HKSCC NOMINEES LIMITED and Hong Kong Securities Clearing Co., Ltd. have increased their shareholdings, Datang Holdings (Hong Kong) Investment Co., Ltd., Xinxin (Hong Kong) Investment Co., Ltd., China Integrated Circuit Industry Investment Fund II Co., Ltd., ChinaAMC SSE Science and Technology Innovation Board 50 Component Exchange-traded Open-ended Index Securities Investment Fund, China Information and Communication Technology Group Co., Ltd., E Fund SSE Science and Technology Innovation Board 50 Component Exchange-traded Open-ended Index Securities Investment Fund, Holdings in SSE 50 exchange-traded index securities investment funds declined.
| shareholder name | number of shares outstanding(10,000 shares). | Proportion of total share capital (%) | change ratio (percentage points) |
|---|---|---|---|
| HKSCC NOMINEES LIMITED | 424182.53 | 53.1813 | 0.030 |
| Datang Holdings (Hong Kong) Investment Co., Ltd | 111685.26 | 14.0024-0.008 | |
| Xinxin (Hong Kong) Investment Co., Ltd. | 61721.48 | 7.7382-0.004 | |
| National Integrated Circuit Industry Investment Fund II Co., Ltd | 12745.81 | 1.5979-0.001 | |
| ChinaAMC SSE STAR Market 50 Component Exchange-traded Open-ended Index Securities Investment Fund | 11458.96 | 1.4366-0.617 | |
| China Information and Communications Technology Group Co., Ltd | 7247.09 | 0.9085-0.001E | |
| Fund SSE STAR Market 50 Component Exchange-traded Open-ended Index Securities Investment Fund | 6889.69 | 0.8637-0.301 | |
| Hong Kong Securities Clearing Company Limited | 3968.12 | 0.4974 | 0.006 |
| SSE 50 ETF | 3735.67 | 0.4683-0.031 | |
| Huatai Pinebridge CSI 300 ETF | 3439.92 | 0.4312 | new |

Proofreading: Sun Ping
Indicator Annotation:
P/E ratio = total market capitalization / net profit. When the company loses money, the P/E ratio is negative, and it is not practical to use the P/E ratio for valuation, and the P/B ratio or P/B ratio is often used as a reference.
Price-to-book ratio = total market capitalization / net assets. The price-to-book ratio valuation method is mostly used for companies with large fluctuations in earnings and relatively stable net assets.
Price-to-sales ratio = total market capitalization / operating income. The price-to-sales ratio method is often used for growing companies that are losing money or making small profits.
The price-to-earnings ratio and price-to-sales ratio in this article are calculated using the TTM method, that is, the data for the 12 months up to the latest financial report (including forecast). The price-to-book ratio is calculated using the LF method, that is, based on the latest financial report data. The quantile calculation range of the three is from the company's listing to the latest announcement date.
When the P/E ratio and price-to-book ratio are negative, the current quantile is not displayed, which will cause the line chart to be interrupted.
Ticker Name
Percentage Change
Inclusion Date