 Third Quarter National Accounts: The Property Market’s Long Shadow
(Yicai) Oct. 28 -- The third quarter , recently released by China’s National Bureau of Statistics (NBS), confirm the pervasive influence that the real estate downturn is having on the macroeconomy.
using input-output tables estimate that residential and commercial real estate account for 24 percent of China’s GDP once all the relevant linkages are accounted for. If we take floor space under construction as our measure of real estate activity, then the property market downturn could be subtracting close to 3 percentage points from GDP growth this year.
In other words, the NBS reported that GDP increased by 4.8 percent in the first three quarters. But growth would have been close to 7.8 percent without the real estate contraction. It would be a mistake to think that 7.8 percent was the economy’s potential growth rate; economic activity has benefitted from supportive policy measures. Nevertheless, this exercise points to an economy with areas of significant strength beneath the weak headline number.
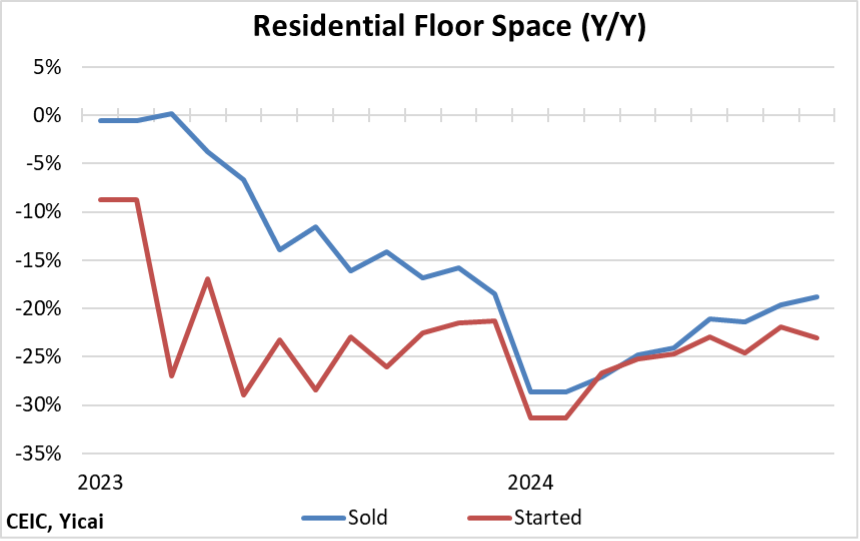
There are some preliminary signs that the property market downturn could be bottoming out. While the volume of residential floorspace sold still fell by 19 percent year-over-year in September, this was a marked improvement from the 28 percent decline in January-February, continuing the positive trend of previous months (Figure 1). There are also some signs of a stabilization in the volume of starts.
Figure 1
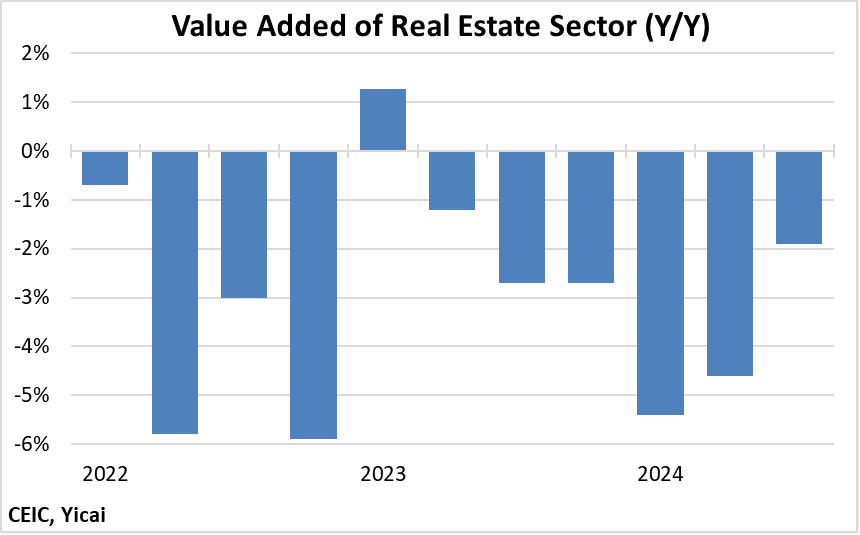
These data are echoed by the NBS’s estimate of the real estate sector’s value added, which contracted by 1.9 percent in Q3. This is a significant improvement from the 5 percent decline in the first and second quarters (Figure 2). Note that according to the production side of the NBS’s National Accounts, the real estate sector comprises 6 percent of GDP. This is the real estate sector’s direct contribution to GDP. It ignores the upstream and downstream linkages accounted for in the 24 percent cited above.
Figure 2
The property market recovery will be supported by a series of recently announced policy measures. Ni Hong, the Minister of Housing and Urban-Rural Development, that the government will boost urban renewal by renovating an additional one million housing units. Moreover, local governments will be allowed to issue special-purpose bonds to turn unsold apartments into affordable housing. Late last month, Pan Gongsheng, the Governor of the People’s Bank, mortgage rates by 50 basis points and lowered the minimum downpayment for second homes from 25 to 15 percent.
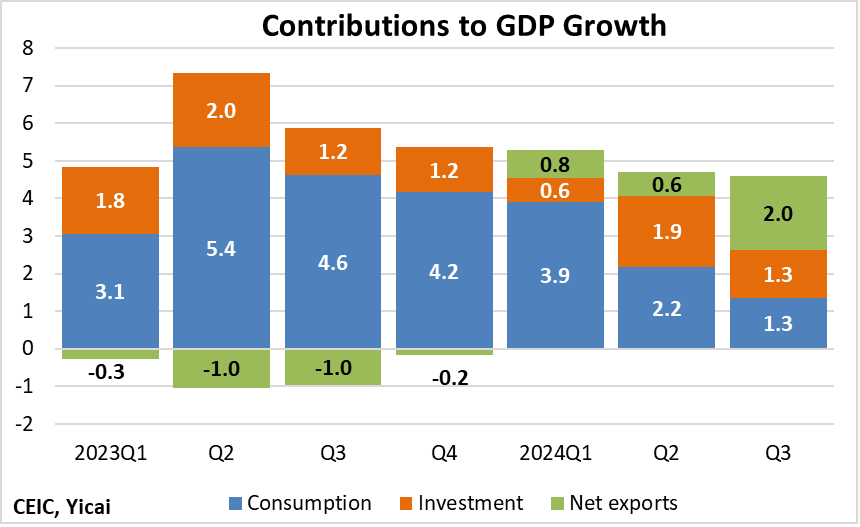
The 4.8 percent GDP growth reported by the NBS for the year-to-date is only a little weaker than the 5.2 percent recorded for 2023 as a whole. However, the data show a slowing quarterly trend resulting from reduced contributions from consumption, which are partially offset by increased support from net exports (Figure 3).
Figure 3
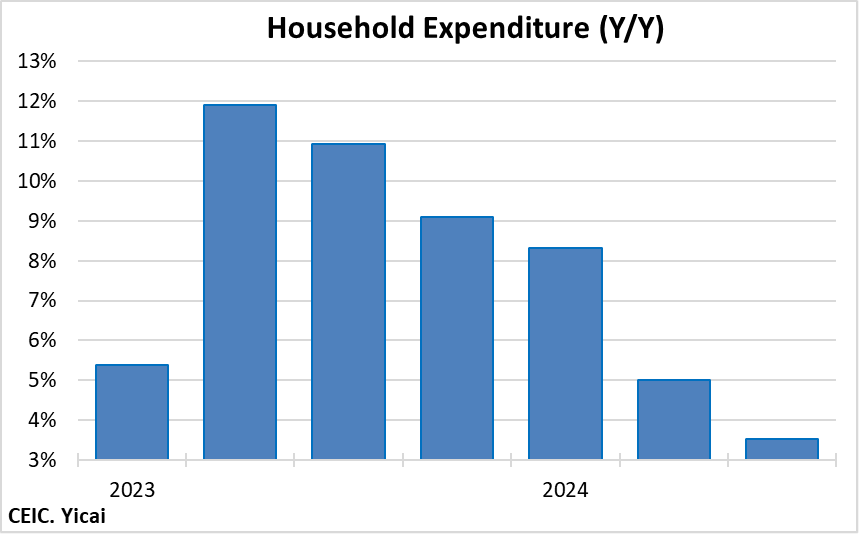
In the year-to-date, household expenditure growth was just 5.6 percent, down from 9.2 percent in the same period last year. The trend is distinctly negative with spending only growing by 3.5 percent year-over-year in the third quarter (Figure 4).
Figure 4
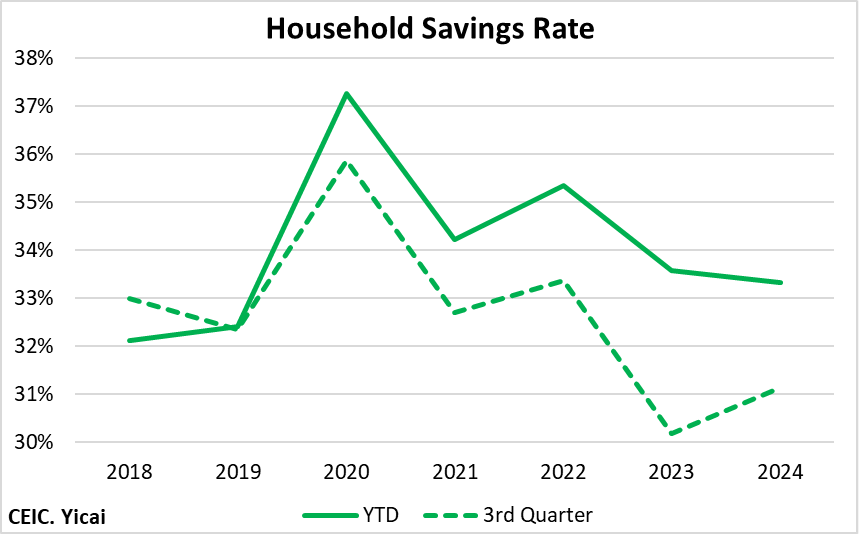
 Some of the slower spending in Q3 can be attributed to a tick up in the household savings rate to 31 percent from 30 percent last year (Figure 5). However, for the year as a whole, the savings rate has actually fallen marginally. This means that slower spending is being driven by a reduction in income growth. Indeed, incomes grew by 5.2 percent in the first three quarters this year, compared to 6.3 percent in the same period last year.
Figure 5
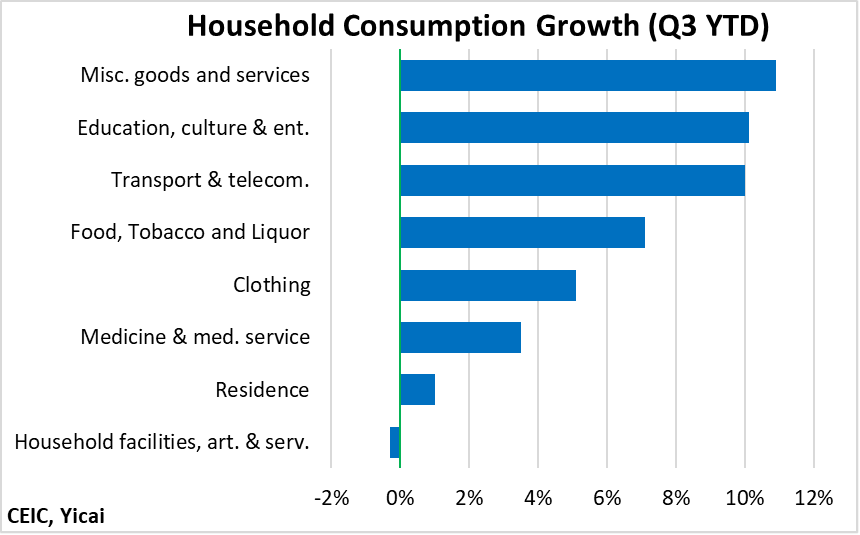
The composition of household spending illustrates the depressive effects of the property downturn. Spending on “Residence” and “Household facilities, articles and services” have been the least buoyant categories so far this year. Nevertheless, households have been quite keen to purchase other items (Figure 6).
Figure 6
Early signs in the fourth quarter show continued willingness to consume. For example, we took our daughters to picturesque Ningbo for the National Day Golden Week holiday. The hotels, restaurants and scenic spots – like the historic – were thronged with vacationers. Apparently, Ningbo wasn’t the only hot tourist destination. China’s Ministry of Transportation that 279 million holiday trips were taken this October, up 5 percent from last year and 25 percent from pre-pandemic levels.
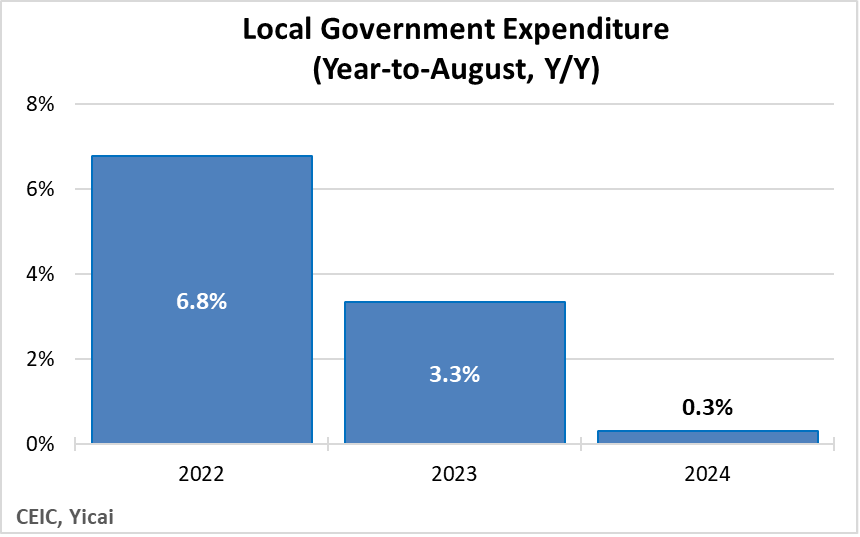
The National Accounts definition of consumption illustrated in Figure 2 includes spending by governments as well as households. The property market downturn is playing a role here as well by reducing local governments’ land sales revenue. As a result, local governments are forced to rein in their spending. In the year-to-date, expenditures by local governments are essentially flat, down from 3 percent growth last year and 7 percent growth in 2022 (Figure 7).
Figure 7
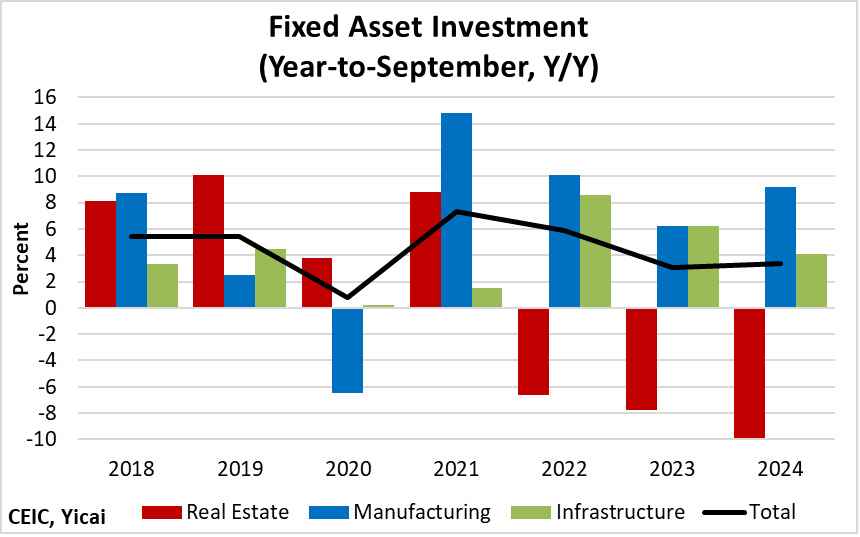
Weak demand for housing has led to investment in real estate falling for the third consecutive year (Figure 8). Abstracting from the real estate sector, investment growth has been more rapid than pre-crisis rates with investment in manufacturing growing particularly robustly. A rotation of investment from real estate to manufacturing bodes well for future productivity levels.
Figure 8
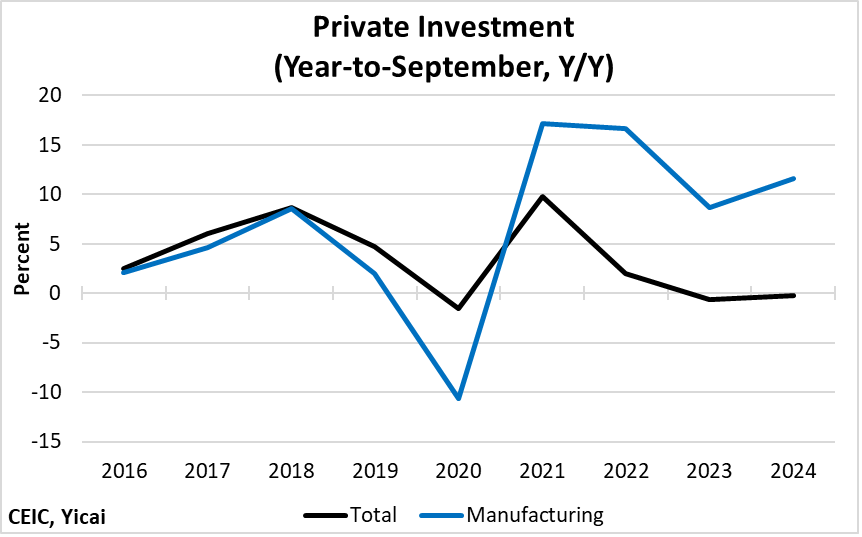
Private sector investment pretty well ground to a halt in the last two years. But I do not think that there has been a collapse in investor confidence. A relatively large share of private sector investment goes into real estate. Even as GDP growth slows, the private sector is investing in manufacturing much more intensively than it did before the pandemic (Figure 9). This suggests that weak private sector investment is a sectoral problem and that entrepreneurs’ confidence in non-real estate undertakings remains fairly high.
Figure 9
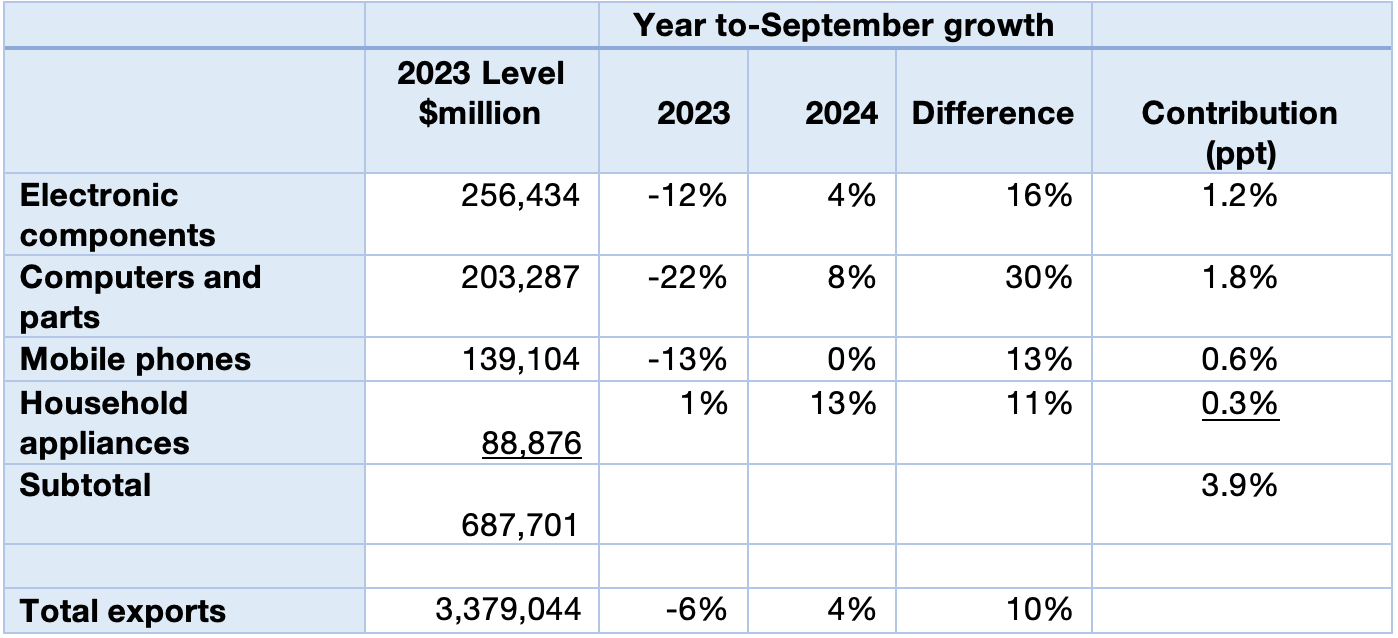
International trade has been a bright spot this year. Exports are up 4 percent in dollar terms after having fallen by 6 percent last year – a swing of 10 percentage points. Nearly two-fifths of this swing is explained by the four key products highlighted in Table 1. Since these products only accounted for one-fifth of the level of exports in 2023, it is clear that exporters in these sectors are punching well above their weight.
Table 1:
Key Export Products in 2024
Turning to exports by destination, Table 2 shows that in all major areas, last year’s declines have turned into this year’s modest increases. The contribution of exports to the US stands out. In 2023, 15 percent of China’s exports went to the US. But the 17 percentage point swing in growth rates – from negative 16 percent last year to 1 percent this year – means that sales to the US accounted for 30 percent of the improvement in China’s overall export growth.
Table 2:
Key Export Destinations in 2024

It is easy for China watchers to become discouraged as the growth of the economy slows. However, a detailed examination of the data reveals that much of the weakness comes from a single – albeit important – sector. Supportive policy will hasten the stabilization of the property market and higher rates of GDP growth will surely follow.