 The ITC’s Report on US Tariffs: Sobering Food for Thought
(Yicai Global) April 3 -- Earlier this month, the US International Trade Commission (ITC) released a on the economic impact of the tariffs originally imposed by President Trump. The ITC is an independent, nonpartisan, quasi-judicial that provides analysis of international trade issues for the President and Congress.
The ITC’s 314-page report is based on an extensive analysis of data on trade, production and prices, the output of its econometric models and the views of interested parties. Representatives of more than 90 organizations testified at the ITC’s hearings in July 2022. Moreover, it received 195 written submissions.
The ITC assessed the impact of two sets of tariffs. The first, under Section 232 of the Trade Expansion Act of 1962, were imposed on US imports of steel and aluminum. The second, under Section 301 of the Trade Act of 1974, were imposed on a variety of imports from China.
The Trump Administration justified the Section 232 tariffs on national security grounds. It argued that the steel and aluminum industries are vital to the US’s national security and that their viability was being undermined by excessive imports. In March 2018, it imposed tariffs of 25 and 10 percent, respectively, on the import of steel and aluminum articles.
Australia, Canada and Mexico were exempted from paying the Section 232 tariff duties. The imports of some other countries, including EU members, were subject to tariff-rate quotas that permitted a limited amount of imports to enter the US duty free.
As you might have expected, the US’s imports of steel and aluminum dropped sharply following the imposition of the tariffs. In volume terms, the imports of steel mill products fell by 17 percent between 2017 and 2021 while those of aluminum decreased by 19 percent.
The tariffs appear to have boosted American production. Between 2017-21, US output of raw steel was up 5 percent while that of finished steel products was essentially flat. Production of wrought and unwrought aluminum were up 15 and 13 percent respectively.
In 2021, capacity utilization in the US steel industry rose to 81 percent, the highest level since 2007. According to the US Department of Commerce, an 80 percent capacity utilization rate is needed for the steel industry to attain long-term financial viability. Unwrought aluminum’s capacity utilization rose from 40 percent in 2016-17 to 55 percent in 2021.
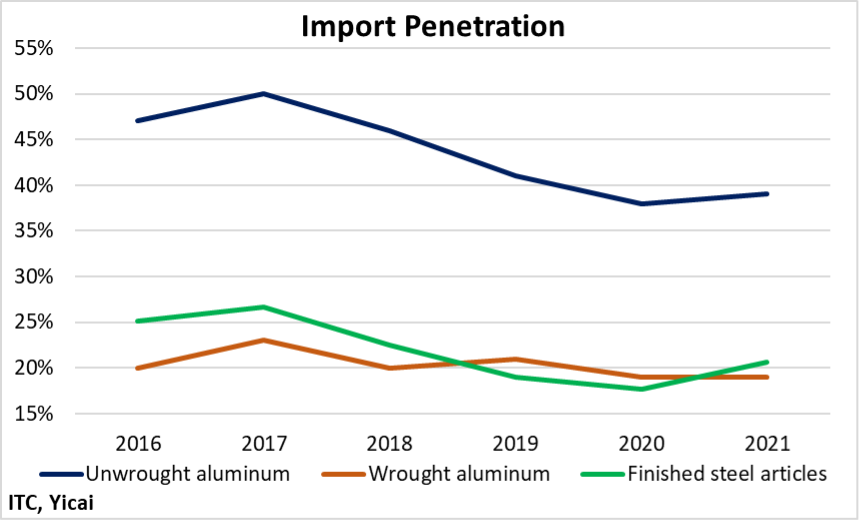
As Figure 1 shows, reduced imports and higher domestic production resulted in a fall in import penetration (imports as a share of US consumption). The fall was most dramatic for unwrought aluminum (10 percentage points) and smallest for wrought aluminum (4 percentage points). This is because unwrought aluminum is an input for wrought aluminum and the tariffs on the former meant less of a competitiveness-enhancing effect for producers of the latter.
Figure 1
The prices of steel and aluminum in the US rose more rapidly than in other countries.
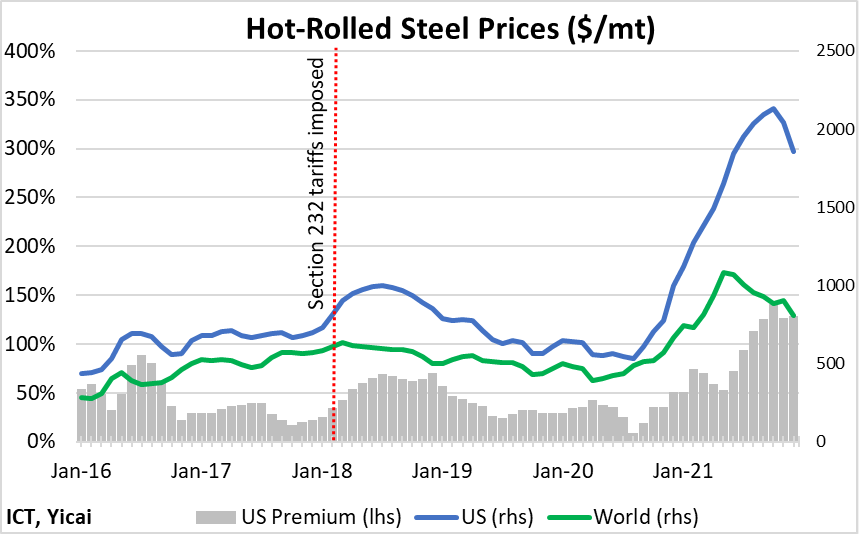
The price of US hot-rolled steel was some 30 percent higher than the world benchmark in 2017 (Figure 2). After the tariffs were imposed the US premium rose to 70 percent. By the fourth quarter of 2021, US hot-rolled steel prices were 130 percent higher than the benchmark.
Figure 2
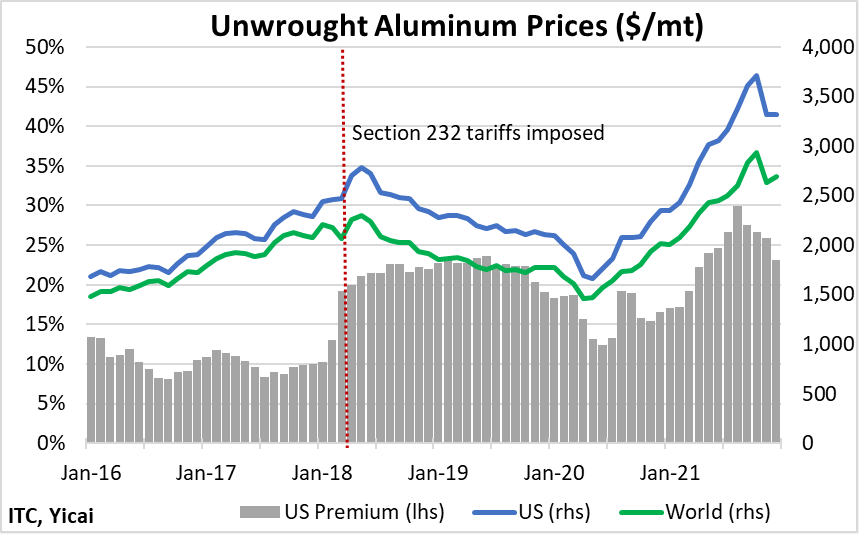
Aluminum prices show a similar, albeit less dramatic, dynamic. In 2017, the prices of unwrought aluminum in the US were 10 percent higher than the global benchmark. After the imposition of tariffs, the price premium doubled. By the fourth quarter of 2021, US prices were 25 percent higher than the benchmark (Figure 3).
Figure 3
The ITC notes that, in addition to the Section 232 tariffs, the US steel and aluminum industries were subject to several shocks which affected trade, production and prices. These include COVID-19, supply chain disruptions, antidumping and countervailing duties, a surge in energy prices and the crisis in Ukraine. The ITC relied on its econometric models to help disentangle the effects of the tariffs from these other factors.
The ITC’s models suggest that Section 232 tariffs reduced imports of steel and aluminum products by 24 percent and 31 percent, respectively, on average over 2018-21.
In addition, the tariffs are estimated to have increased prices of the affected imported steel and aluminum products by 23 percent and 8 percent and of domestically produced steel and aluminum by about 0.7 percent and 0.9 percent.
On average, over the three years, US production of steel and aluminum were USD1.5 billion and USD1.3 billion higher each year, respectively, than they would have been absent the tariffs.
While the tariffs were a boon for steel and aluminum producers, those in other industries were not so lucky. The increase in steel and aluminum prices translated into higher production costs for those businesses that use these products as inputs. As a result of these higher costs, these downstream industries cut back on their own production. The ITC’s modelling suggests that the average annual decrease in production for these industries was USD3.4 billion over 2018–21. This implies that the Section 232 tariffs imposed an annual net cost of USD0.6 billion, as the losses of the downstream industries exceeded the gains of the steel and aluminum producers.
The Trump Administration imposed a series of tariffs on imports from China in four tranches between July 2018 and September 2019. It justified its actions by arguing that longstanding Chinese practices related to technology transfer, intellectual property and innovation imposed an unreasonable burden on US commerce.
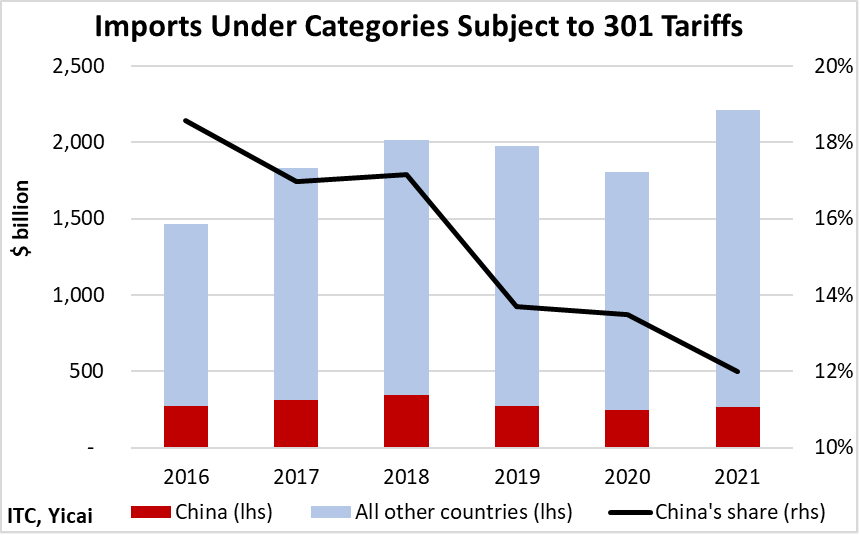
By 2020, about half of all the US’s import value from China was subject to tariffs. Figure 4 shows US imports of those goods for which China was subject to Section 301 tariffs. In 2017, China accounted for 17 percent of the value of these imports. By 2021, its share had fallen to 12 percent.
Figure 4
The ITC’s econometric modelling suggests Chinese imports were quite sensitive to the Section 301 tariffs with a one percentage point increase in the tariff rate leading to a 2 percent decline in the volume of exports. Thus, correcting for other factors, the ITC estimates that the Section 301 tariffs led to a 13 percent decline in the value of US imports from China in the affected sectors.
The ITC finds that the cost of the tariffs was fully passed through to the US importers of Chinese goods. Chinese exporters maintained their prices while US importers absorbed the costs of the tariffs through a combination of reduced margins and higher prices for consumers or downstream buyers.
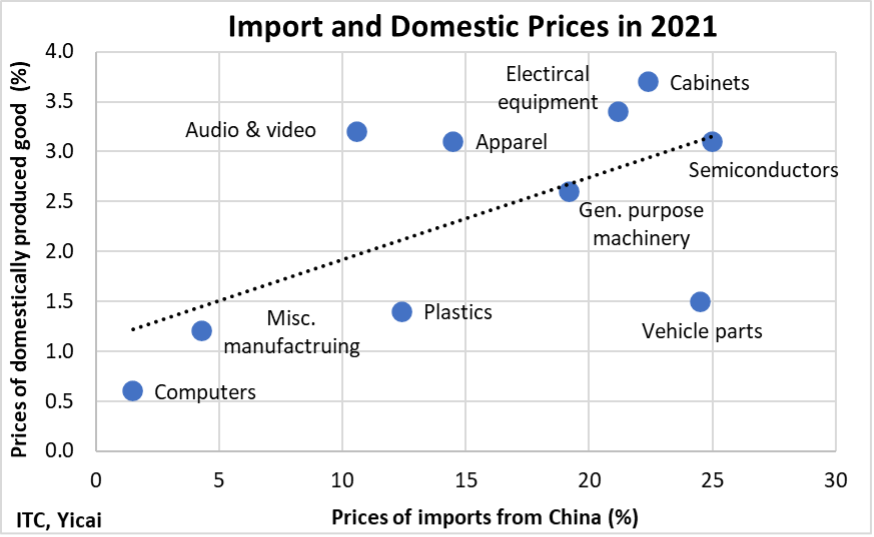
The ITC does not estimate the overall contribution of the Section 301 tariffs to inflation in the US. However, its model suggests that there is a strong correlation between the increase in the cost of Chinese imports and the amount by which American producers were able to raise their prices (Figure 5).
Figure 5
The US’s trade partners filed WTO disputes in response to the Section 301 and Section 232 tariffs. In September 2020, a WTO panel found that the imposition of the Section 301 tariffs was inconsistent with the US’s obligations under the General Agreement on Tariffs and Trade. In December 2022, a panel rejected the US’s national security justification for the Section 232 tariffs, noting that they did not come at a time of war or other emergency.
The US has appealed the panel rulings. This was a cynical move. The WTO’s appellate body is unable to hear appeals because the US refuses to allow the appointment of new members. This means that the cases will be in legal limbo for the foreseeable future.
The ITC’s report focuses on the short-term effects of the Section 232 and Section 301 tariffs. According to the ITC, the report cannot be used to draw broad conclusions about whether the tariffs produced a “net benefit” for the U.S. economy.
Still, it is hard to see what these tariffs achieved.
The ITC’s analysis suggests that the Section 232 tariffs resulted in a net loss for the economy and a supply chain for steel and aluminum with prices that are increasingly out of line with global benchmarks.
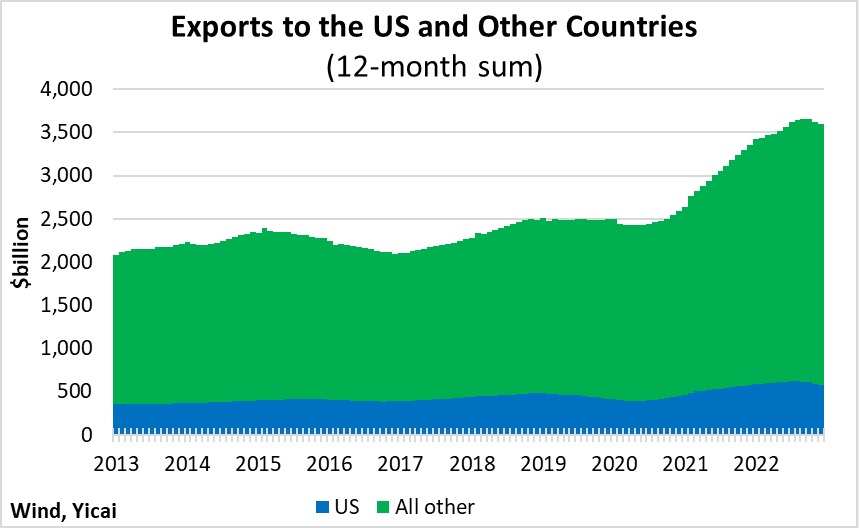
The Section 301 tariffs raised prices on a wide variety of goods at a time when the US is struggling to keep decades-high inflation in check. While China is losing market share in the US, it has successfully found receptive markets in other countries (Figure 6).
Perhaps most disturbing is the way the US’s imposition of these tariffs and its attitude toward the WTO have disrupted the operation of the rules-based global trading system. Let’s hope that the ITC’s report provides American policymakers with sobering food for thought.
Figure 6
