 Mobility Gap Points to Contraction in November
(Yicai Global) Dec. 2 -- In November, China was hit hard by a third wave of Covid infections.
The first wave began in Wuhan in early 2020. This outbreak was largely confined to Hubei Province and average daily infections that February were less than 2500.
The second wave, which broke this spring, was centered in Shanghai, although a large number of infections were reported in Jilin Province as well. Average daily infections in April were just over 20,000.
The third wave started in early November. Unlike previous waves, it is impacting numerous regions at the same time. Guangdong in the south, Chongqing in the west and Beijing and Hebei in northern China have all reported major outbreaks. Average daily infections in November were roughly the same as those in April. However, the most recent daily readings, as the month draws to a close, have been over 35,000, suggesting that December could be heavily affected too. Daily infections never exceeded 30,000 during the first or second waves.
There are numerous channels through which a Covid outbreak can pressure economic activity. Among these, the pandemic’s effect on consumers’ willingness to spend is the easiest to see. The increase in infections during the first and second waves led to sharp reductions in retail sales (Figure 1).
Figure 1
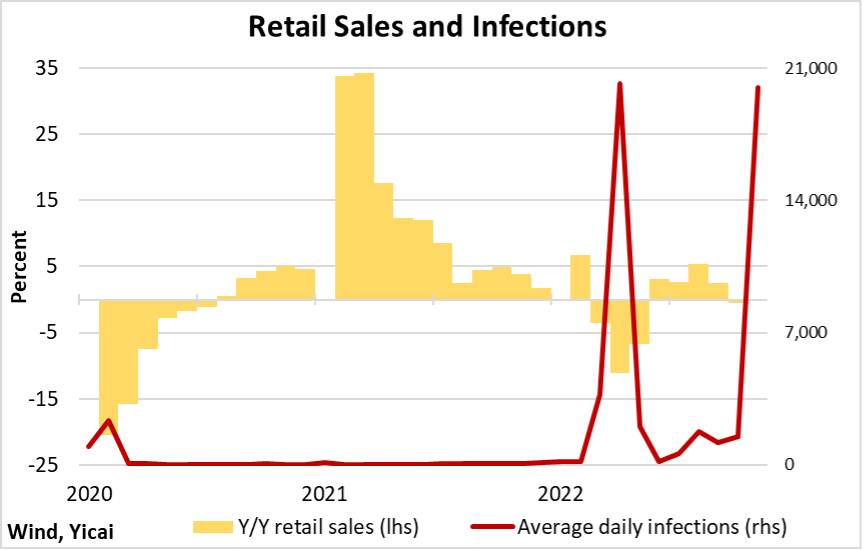
October’s half-percent decline in retail sales followed a rise in average daily cases to 1,500 from a recent low of 170 in June. Based on past experience, we should anticipate a major decline in retail sales in November and continued weakness in December as well, if the outbreak is not controlled quickly.
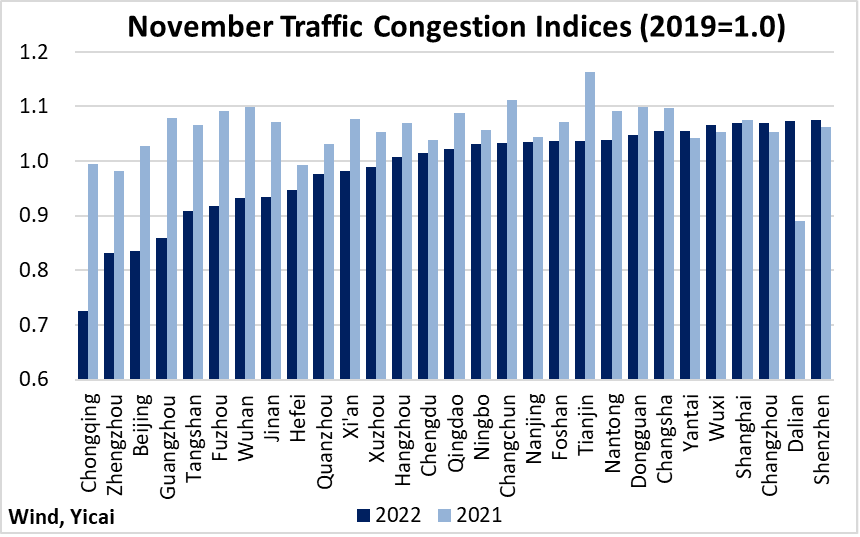
During the first and second outbreaks, I relied heavily on the traffic congestion data provided by Amap (高德) – a Chinese mapping, navigation and location-based service provider – to help assess the impact of the pandemic on economic activity. I take AMAP's daily traffic congestion index for each of the Mainland's 30 biggest cities and express them as a ratio to their 2019 averages. A higher number indicates more traffic congestion. Comparing the data for November 2022 and November 2021, it is easy to see just how widespread the Covid-induced dislocation has become.
Figure 2 ranks China’s biggest cities by their November 2022 traffic congestion indices. For Chongqing through Jinan, traffic congestion was significantly lower than year-ago levels. No cities appear to be picking up the slack from those battling the virus. Dalian is the only city to register a large increase, but this seems more related to weakness a year ago rather than strength now.
Figure 2
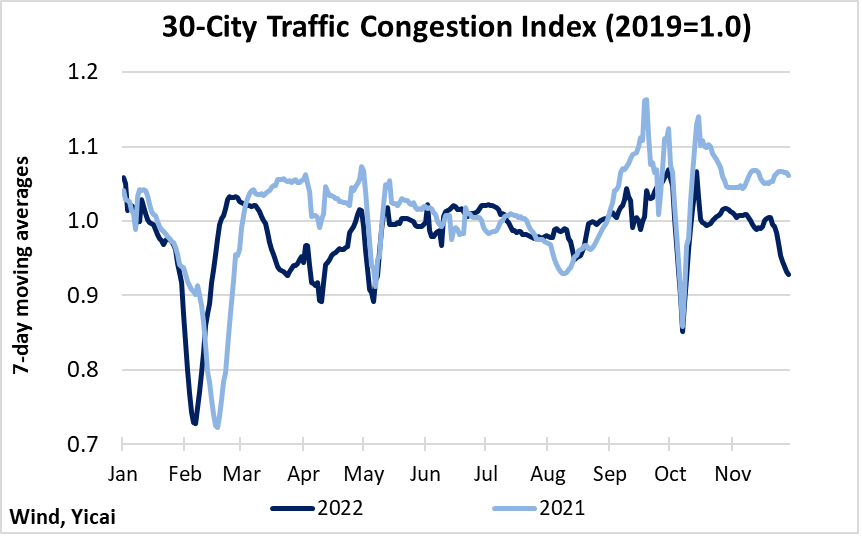
To get a country-wide picture, I create a weighted average of the 30 cities’ indices using municipal GDPs as weights. Our 30-city index for both 2021 and 2022 is presented in Figure 3. It shows the effect of the second wave on mobility during April and May 2022, when traffic congestion remained well below 2021 levels. A gap of a broadly similar magnitude has arisen in October-November.
Figure 3
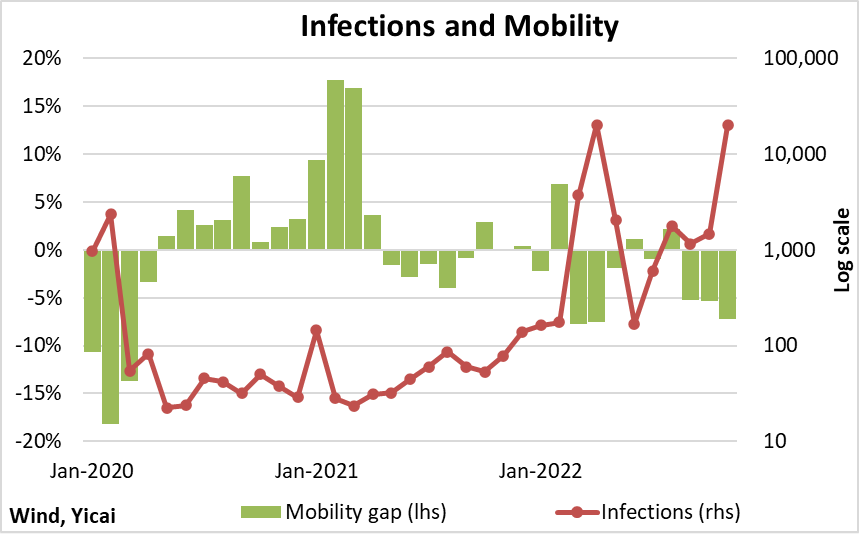
Unsurprisingly, reductions in mobility are driven by spikes in infections (Figure 4). It seems like each time monthly average infections rise above 1000, traffic congestion falls, creating a large negative mobility gap (the percent difference between the current month’s traffic congestion index reading and that of a year ago).
Figure 4
We want to quantify the extent to which reduced mobility will act as a drag on economic activity in November.
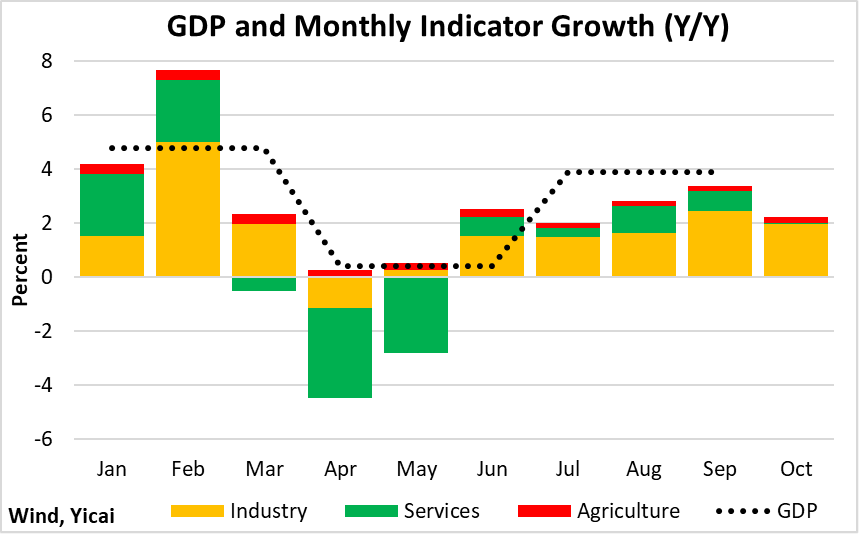
Here, we rely on our monthly GDP indicator (Figure 5) to give us a broad picture of economic output on a monthly basis. Our monthly GDP indicator combines the National Bureau of Statistics’ (NBS) series for industrial value-added and service production with an estimate for the agricultural sector. We weight these three elements by the agricultural, industrial and service sectors’ share of national output. The monthly indicator is expressed in percent year-over-year terms and it is comparable with the NBS’s year-over-year growth of quarterly GDP.
Figure 5
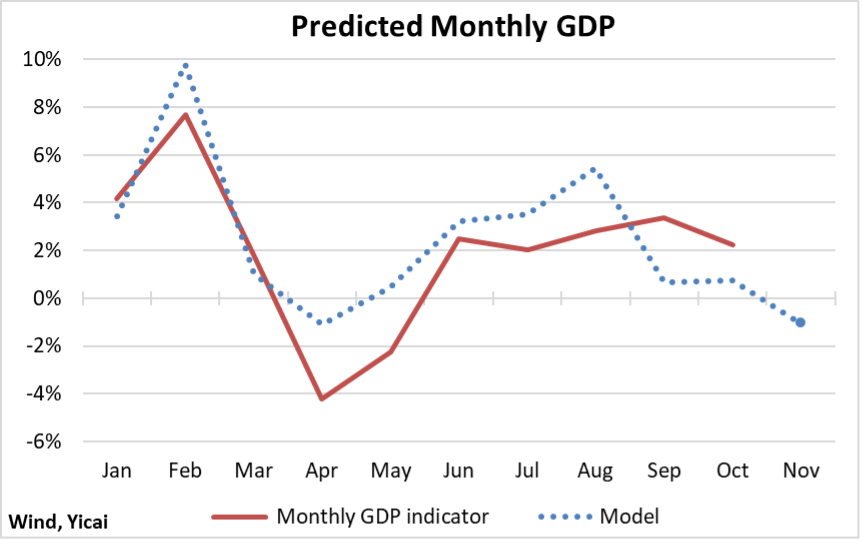
We estimate a simple model in which the monthly indicator’s current value is a function of the previous month’s value and the current month’s mobility gap. The model is estimated over 2018-21 and the parameters are used to project values for 2022 (Figure 6).
The model successfully predicts the cycles we have seen this year in economic activity. Growth in January-February was rapid. It slowed sharply in the March-May period before picking up in the summer months.
With the mobility gap in the -5 percent range in September-October, the model predicted that monthly indicator growth would fall below 1 percent. In the event, the monthly indicator averaged 3 percent growth over the two months.
The mobility gap fell to -7 percent in November. This is still somewhat less severe than the -8 percent mobility gap recorded in March and April. Nevertheless, on the basis of reduced mobility, the model sees the monthly indicator falling by 1 percent.
Figure 6
This simple model ignores many of the important complexities of the economy to focus on the effect of the mobility gap on growth. It suggests that a 1 percentage point increase in the mobility gap would reduce that month’s rate of growth by 0.7 percentage points.
Covid’s contractionary effects can be offset by other factors and this model could be too bearish. Still, this exercise points to the increase in pandemic-related pressures which weigh on the economy as the year draws to a close.