 Is China’s Recovery Sputtering?
(Yicai Global) June 21 – Like April’s numbers, the economic data released by the National Bureau of Statistics (NBS) for were disappointing.
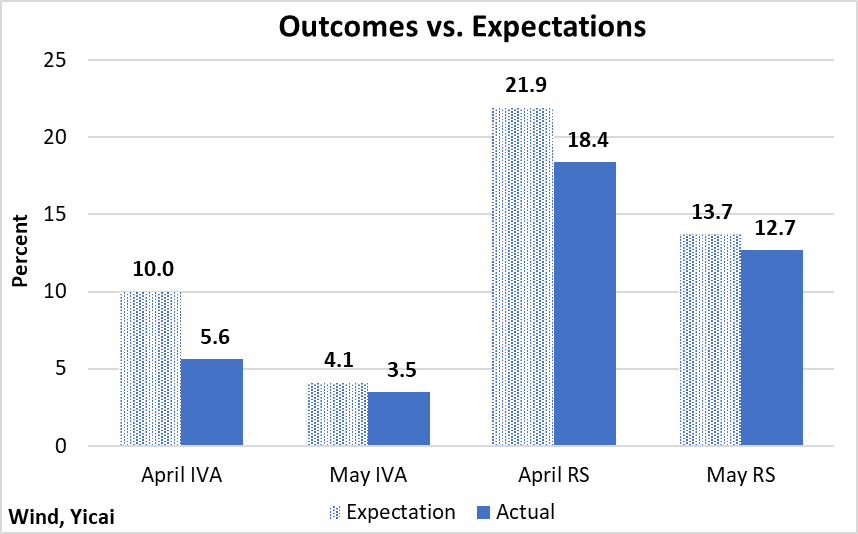
For both industrial value added and retail sales, the outcomes the NBS reported were weaker than the of the Chief Economists surveyed by the Yicai Research Institute.
The dislocation last year has made forecasting year-over-year growth particularly difficult. Historically, the spread between the Chief Economists’ most optimistic and most pessimistic predictions for industrial value added has been about 1 percentage point. In April, the gap was close to 8 percentage points and it was still 2 percentage points in May.
Informed by April’s outcome, the reduced uncertainty in May did make for more accurate predictions and the errors the Chief Economists made – for both industrial value added (IVA) and retail sales (RS) – fell significantly (Figure 1).
Figure 1
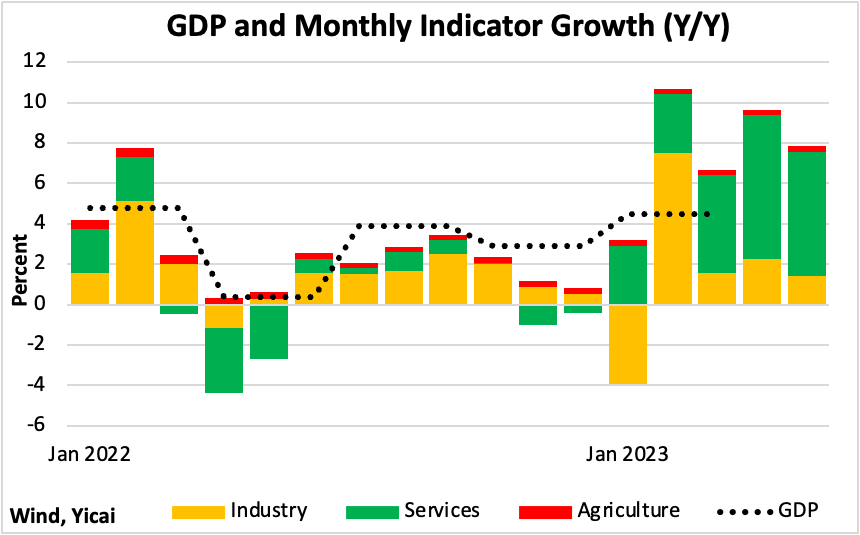
Our monthly model suggests that GDP growth in May was almost 8 percent, down from close to 10 percent in April (Figure 2). The economy continues to be driven by services. So far this year, services have contributed 72 percent to monthly GDP growth. Since they only account for 53 percent of GDP, their over-sized contribution is a testament to how rapidly services have grown this year.
Both consumer and business services were strong in May. The NBS indicated that in addition to accommodation and catering, vigorous growth was recorded in leasing and business services, wholesale and retail trade and information transmission, software and technology services.
Figure 2
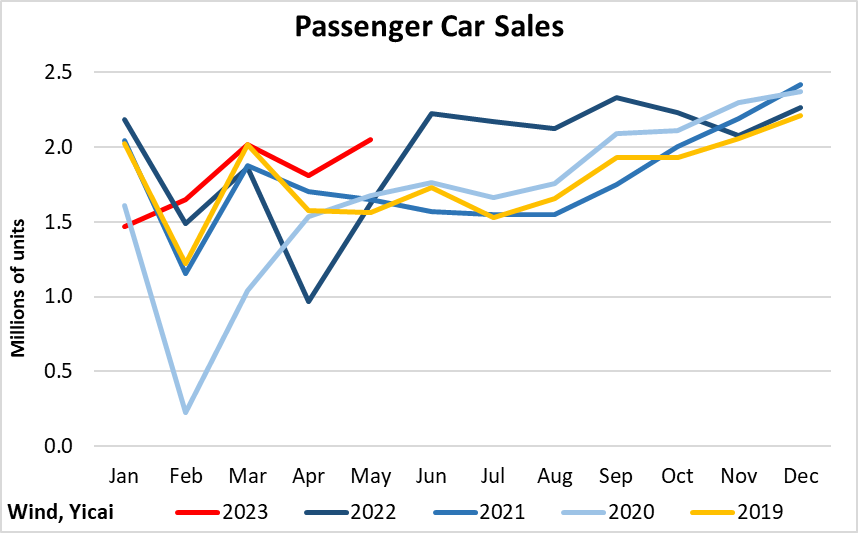
The most inspiring consumption-related indicator came from the auto sector: passenger car sales were up 26 percent year-over-year, in volume terms, in May. Unlike other consumption data, the growth in car sales is not distorted by weakness a year ago (Figure 3). Indeed, May’s sales were 31 percent higher than those of May 2019, before the pandemic broke.
Strong sales of consumer durables, like cars, are typically a sign of buoyant consumer confidence: in uncertain times, one makes do with their old vehicle a bit longer. May’s auto sales could also have been boosted by the . The sense that prices will not fall further likely offered potential buyers, who were waiting for the best deal, an inducement to finally buy that car.
Figure 3
The production-related news was more sobering. Notwithstanding a weak base, industrial value added only grew by 3.5 percent year-over-year in May. This is significantly slower than the 5.7 percent growth recorded before the pandemic.
There were two areas of weakness.
First, it appears that low commodity prices are making it unprofitable for China’s upstream industries to produce. The value added of the mining industry shrank by 1.2 percent in May. Manufacturers of mid-stream goods have increasingly turned to cheaper imports instead of domestic products. Purchases of foreign coal, crude oil and various ores are all up sharply this year.
The second area of weakness was in high-tech consumer products like mobile phones, laptops and tablets. Many of these products are exported and in the cases of mobile phones and laptops, the decline in exports was significantly larger than that of production, suggesting that weak foreign demand for these goods played an outsized role in their reduced production.
Figure 4

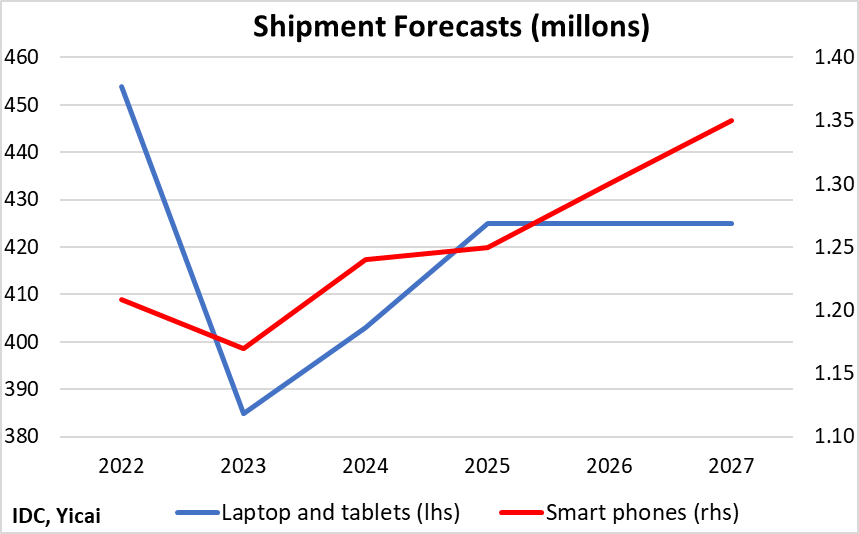
Foreign demand for these products is not expected to snap back.
Industry experts are that global laptop and tablet shipments will fall by 15 percent in 2023, as consumers tighten their belts. In 2024, shipments should grow by close to 5 percent, led by stronger demand from firms. By 2027, shipments are forecast to be more than 10 percent higher than this year but still 6 percent below 2022 levels. Their outlook for smartphones is more , with this year’s 3 percent decline to be followed by steady growth such that by 2027, shipments would be 12 percent higher than in 2022 (Figure 5).
Figure 5
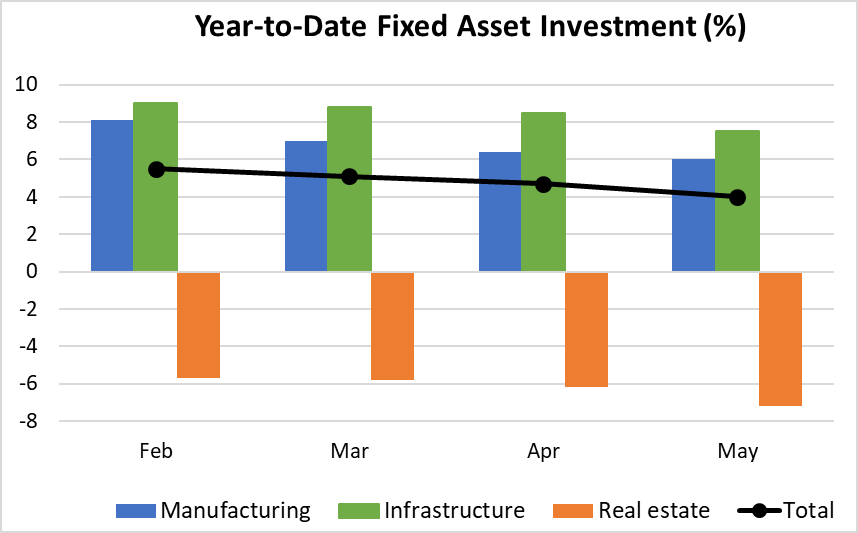
Fixed asset investment has been another disappointing area, as all three segments – manufacturing, infrastructure and real estate – have lost momentum this year (Figure 6).
Figure 6
A lack of confidence remains a break on investment by private firms. In the first five months of the year, private fixed asset investment fell by 0.1 percent. So far this year, private fixed asset investment has accounted for 54 percent of overall investment spending. Its share has dropped by more than 11 percentage points since peaking in 2015 (Figure 7).
Much, but not all, of the weakness in private fixed asset investment appears to have come from the real estate sector. by the NBS suggest that 36 percent of private investment is in real estate. If the decline in private real estate investment was the same as that of the overall sector (-7.2 percent), then private investment in all other sectors was up 3.9 percent year-to-date. This would still be slower than the 6 percent growth for investment in the manufacturing sector overall.
Figure 7

Real estate remains in the doldrums.
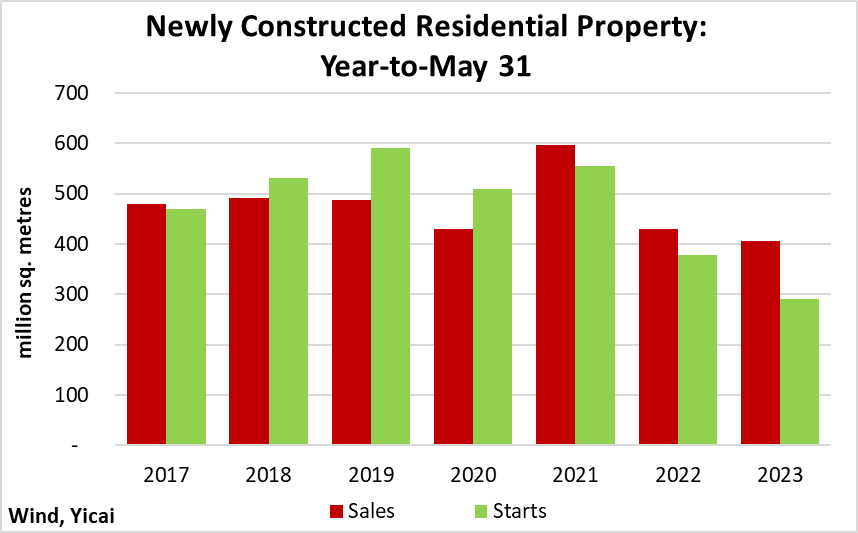
Sales of new homes have weakened since April and, for the first five months of the year, are 5 percent lower than last year. Starts of new homes are falling even faster and are now down 23 percent year-to-date (Figure 8). The good news is that developers continue to make progress in finishing their housing projects. Completions are up 19 percent year-to-date.
Figure 8
With housing supply falling faster than housing demand, new home prices are on the rise again (Figure 9). Higher prices – and the expectation of further increases – will be key in rekindling new home purchases and the bottoming out of the sector. However, it is not clear how much further prices need to increase.
Figure 9

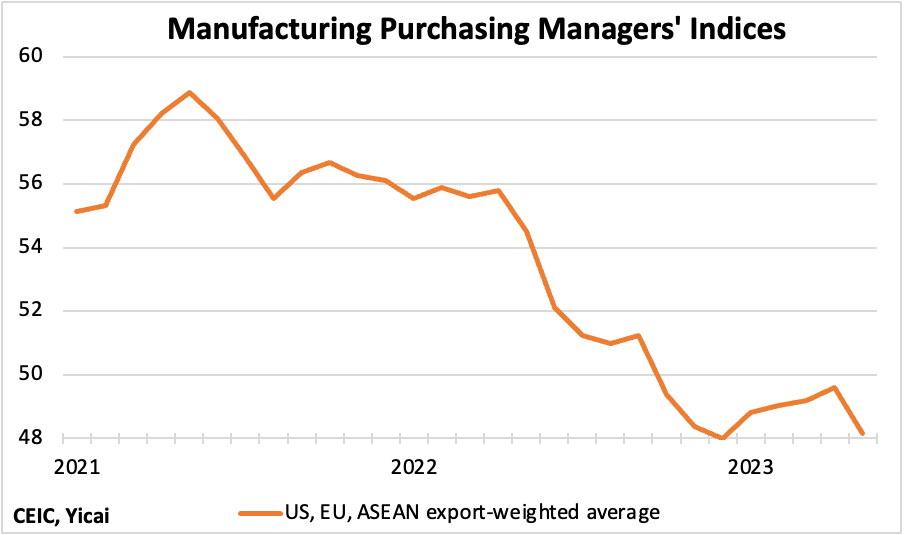
Exports were down 8 percent in May (in dollar terms) but they remain a touch higher than last year on a year-to-date basis. The manufacturing purchasing managers’ indices for China’s major trading partners suggests that export demand fell in May, aborting a recovery that began in January.
Figure 10
With industrial value added, fixed asset investment, real estate and exports all weak, is it still possible for the economy to hit the government’s 5 percent target?
I think it will be.
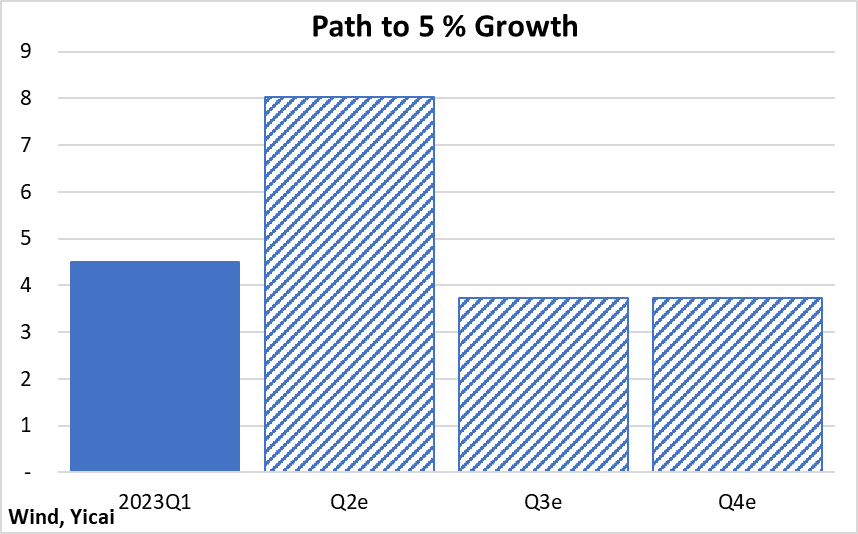
Consider Figure 11. GDP growth was 4.5 percent in the first quarter. Looking at the April and May data and building in some further slowing in June, the second quarter could come in at 8 percent. That would mean that growth in the final two quarters only needs to average 3.7 percent to hit 5 percent for the year.
Figure 11
A lot will depend on the evolution of domestic consumption. There is still a lot of pent-up demand in China’s huge consumer market and people do seem inclined to make purchases.
With the school year drawing to a close, we are planning to take our daughters travelling. Even though we do not plan to go to one of the famous hot spots, my wife – who handles all our travel logistics – tells me the train tickets we want sell out as soon as they are put online. That’s tough for us but it does make me feel good about people’s willingness to spend.
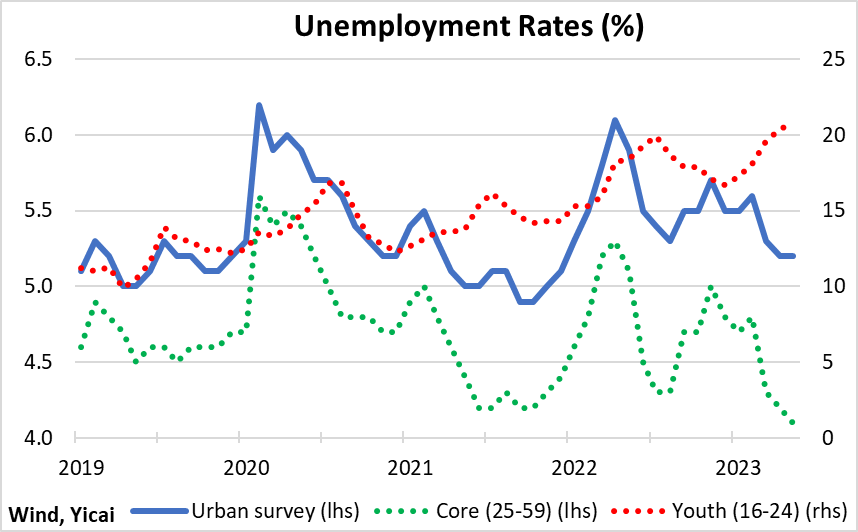
Looking ahead, a full recovery will come about when robust consumer demand is strong enough to pull up industrial production and investment spending. Thankfully, the slower-than-expected growth has not had an adverse effect on China’s labour market. The unemployment rate for core workers aged 25-59 remains well below pre-pandemic levels (Figure 12). That gives me confidence that better times lie ahead.
Figure 12
