 Is China Still an Attractive Investment Destination?
(Yicai Global) Sept. 10 -- Since the outbreak of the pandemic in 2020, supply chain resilience has increasingly preoccupied business leaders and the conflict in Ukraine has only accentuated those concerns. , a global management consulting firm, interviewed 115 manufacturing executives in March. Of these, 92 percent said that they have reshored or are considering reshoring their manufacturing operations to the US. This was up sharply from 78 percent in the previous year’s survey.
In addition, China’s stringent Covid control measures have led multinational companies to their global production strategies and re-assess the role that China should play.
It’s not just talk. There are numerous of new manufacturing facilities being built in the US.
In view of these developments, is China still an attractive investment destination?
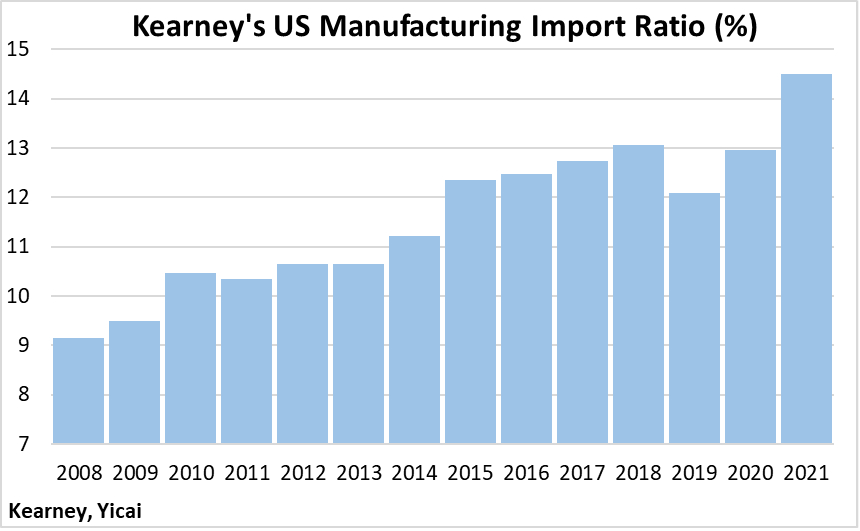
Kearney creates a Manufacturing Import Ratio by dividing the US’s imports of manufactured goods from 14 low-cost Asian countries by the US’s own manufacturing output. Kearney’s Manufacturing Import Ratio rose to 14.5 percent in 2021 from 13.0 percent the previous year (Figure 1). A higher ratio of manufactured imports to domestic production indicates that offshoring rather than reshoring has taken place. Indeed, no trend toward reshoring can be seen in Kearney’s data.
Figure 1
Kearney also calculates a China Diversification Index, which is the share of the US’s 14 low-cost Asian countries’ imports that comes from Mainland China and Hong Kong. This index fell from 66 percent over 2017-18 to 55 percent in the fourth quarter of last year (Figure 2).
Figure 2
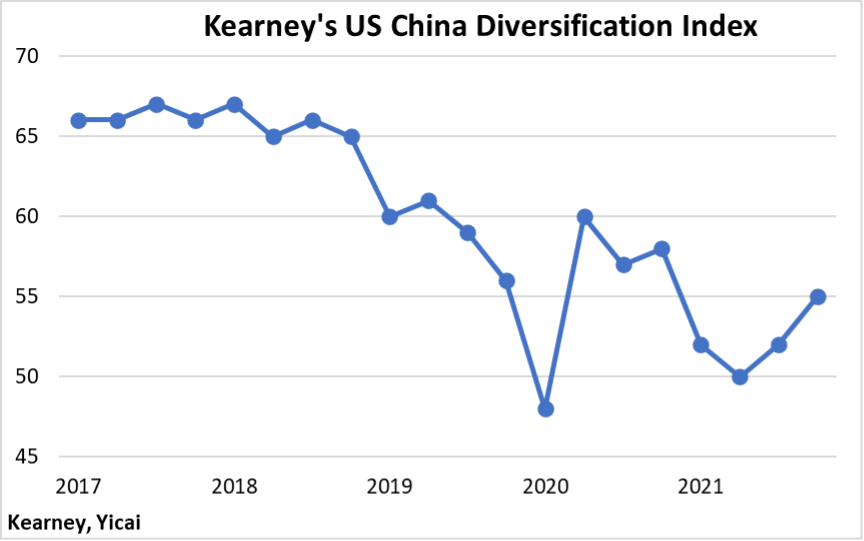
Putting these two datasets together, we see that while the US has actually become increasingly dependent on Asian production, some of the goods it used to buy from China now come from competing Asian countries. This is not surprising given the large tariffs on Chinese imports that are still in place.
The simplest way to assess China’s attractiveness as an investment destination is to look at the trend of foreign direct investment (FDI) into China. Here, we examine the data provided monthly by MOFCOM.
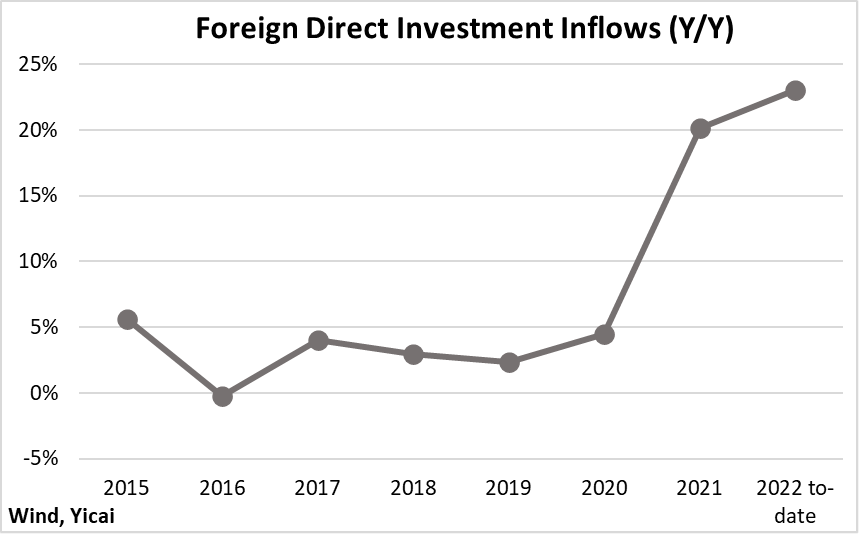
The MOFCCOM data show that after having grown at an average annual rate of 3 percent between 2015 and 2020, annual FDI inflows jumped by 20 percent in 2021 (Figure 3). Moreover, the data for January through July of this year shows growth in excess of 20 percent.
These high-frequency data do not suggest any cause for concern.
Figure 3
We can make better sense of China’s FDI numbers if we look at them in a global context.
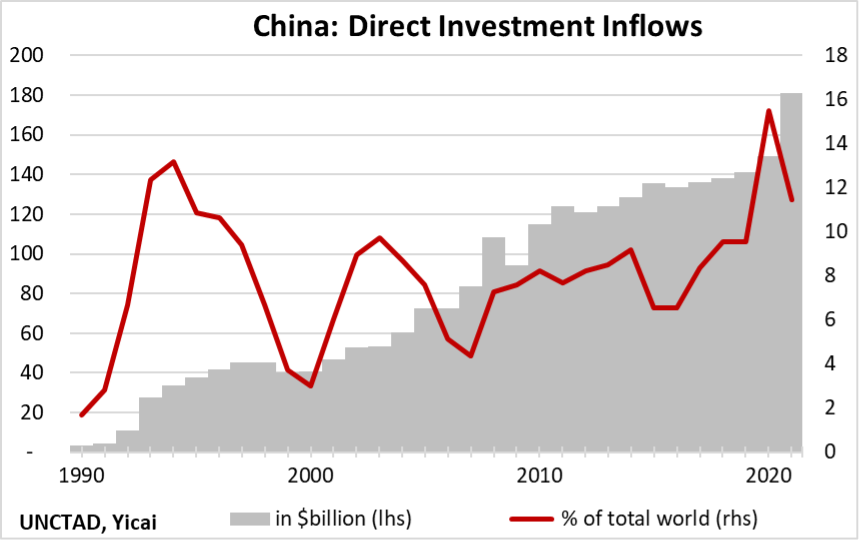
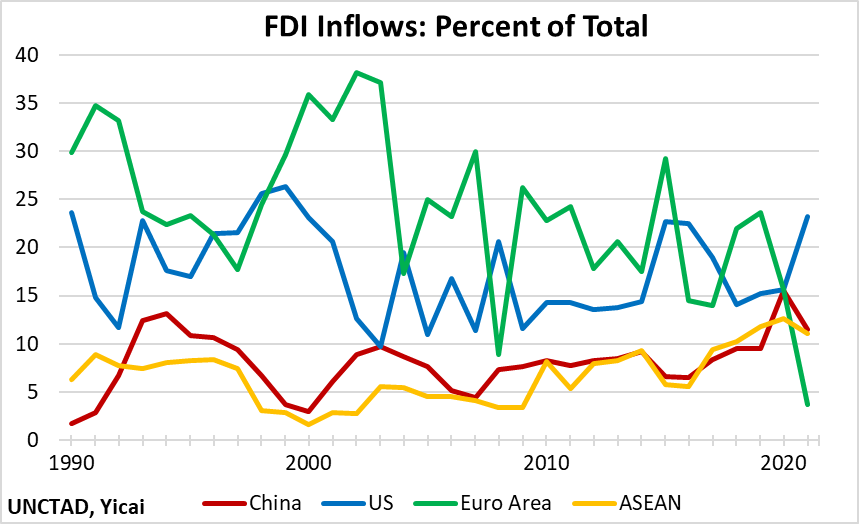
The data collected by the United Nations Conference on Trade and Development (UNCTAD) show that China’s FDI inflows rose from under $4 billion in 1990 to $181 billion in 2021 (Figure 4). China’s share of global FDI flows rose from 1.7 to 11.4 percent over that period. But the trend of China’s global FDI share was not smooth and steady. FDI rose rapidly in the mid-1990s, as China relied on foreign capital to build its manufacturing base. Between 2000 and 2019, China took in close to 8 percent of global FDI on average. In 2020, its share spiked to 16 percent before settling at 11 percent last year.
These data indicate that China’s importance as an investment destination has actually improved in recent years.
Figure 4
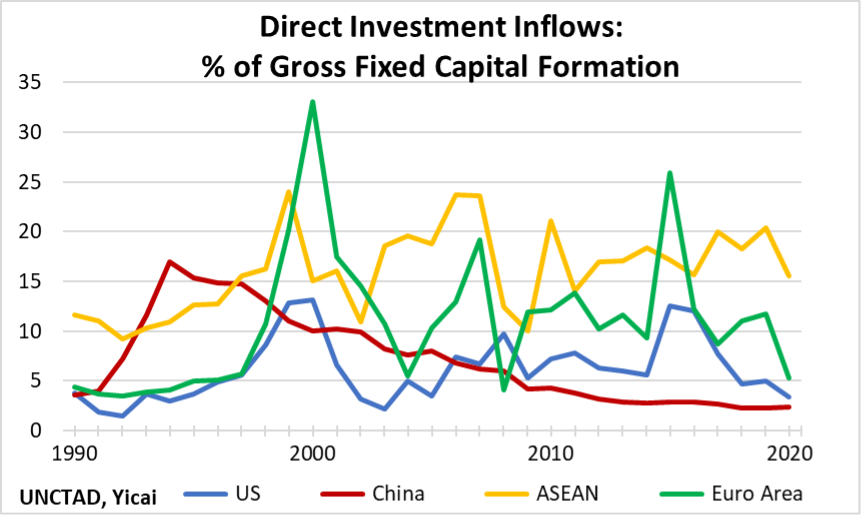
While China is receiving a growing share of the world’s FDI flows, it has become much less dependent on foreign investment. The UNCTAD data allows us to express the annual FDI inflows as a share of each country’s gross fixed capital formation (GFCF). In 2020, FDI inflows fell to the equivalent of 2 percent of China’s GFCF, down from a peak of 17 percent in 1994 (Figure 5).
It is worth noting that China is less dependent on FDI inflows than the ASEAN countries, those of the Euro Area and even the US.
China’s high domestic savings means that it need not rely on FDI to fund its investment needs. Still, FDI is crucial for China because foreign firms often bring in cutting-edge technology and international best practices. FDI’s small but specialized role is what the “Dual Circulation Strategy” highlights.
Figure 5
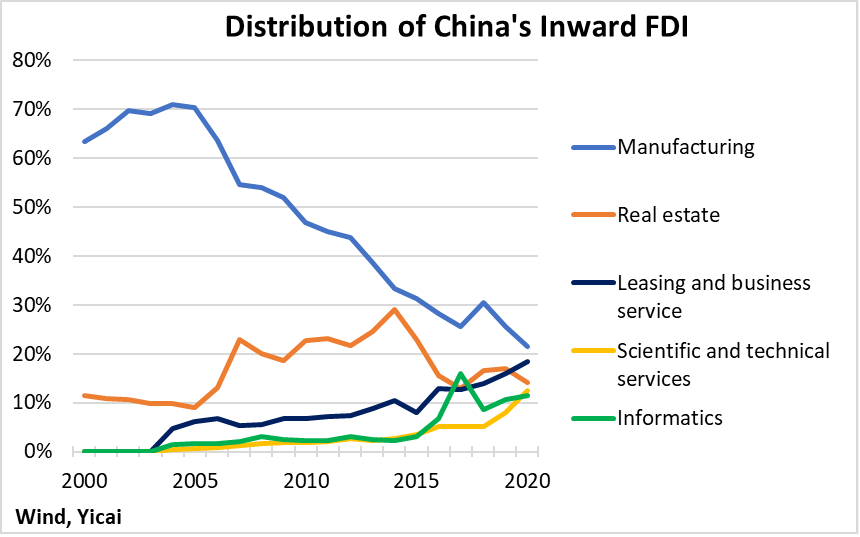
The nature of foreigners’ investments in China has also evolved. In the early 2000s, two-thirds of the inflows went into manufacturing (Figure 6). Real estate became an increasingly attractive sector, absorbing close to 30 percent of the FDI inflows in 2014. More recently, foreigners have invested in leasing and business services, scientific and technical services and informatics.
Figure 6
The US has been the number one destination for FDI inflows in each of the last ten years, averaging 17 percent of the global total (Figure 7). China has ranked second in eight of the last ten years but only averaged 9 percent. The Euro Area averaged 18 percent and the ASEAN countries averaged 9 percent, with a profile that looks remarkably similar to China’s.
Figure 7
Firms are taking a variety of measures to strengthen supply chains including diversifying sources of supply, increasing inventories as well as reshoring. Analysis of earning call transcripts by economists at suggests that reshoring is an expensive alternative – given surging US labour costs – and that firms are more likely to reinforce their supply chains by overstocking their inventories.
From China’s side, there are three key factors behind its ongoing attractiveness as an investment destination.
First, multinationals like to be close to their customers. This is the case for manufacturers but even more important for service providers. The Chinese market is large and increasingly wealthy. Moreover, as the share of services in its GDP continues to rise, international service providers will likely locate a growing share of their operations in China.
Second, China has implemented specific policies to attract FDI. In 2018, it increased the transparency of its investment regime by publishing a “negative list” of the industries in which foreign investment is prohibited. Those industries not on the list are open. In 2018, there were 152 industries on the list. The number of prohibited industries has fallen continuously over time and now stands at 117 (down 23 percent). Similarly, China has expanded the number of sectors in which it FDI – through preferential tax and land use policies – from 348 in 2017 to 516 in 2022 (up 48 percent).
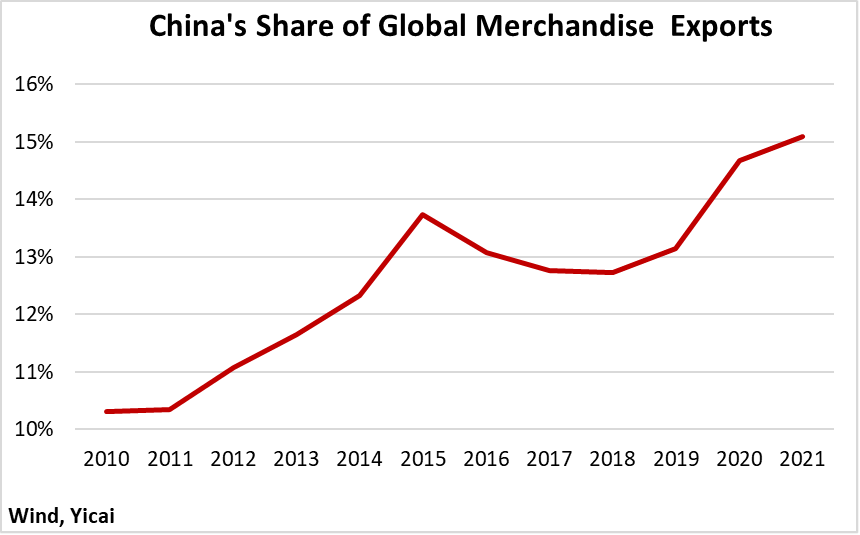
Third, notwithstanding the difficulties caused by the country’s pandemic control measures, China remains a reliable export platform. Its share of global merchandise exports rose rapidly in 2020 and ticked up over 15 percent in 2021 (Figure 8). Foreign firms account for close to 40 percent of China’s exports and they appreciate China’s complete and relatively resilient supply chain.
Figure 8
