 Improving China’s Consumption: What Do Survey Data Suggest?
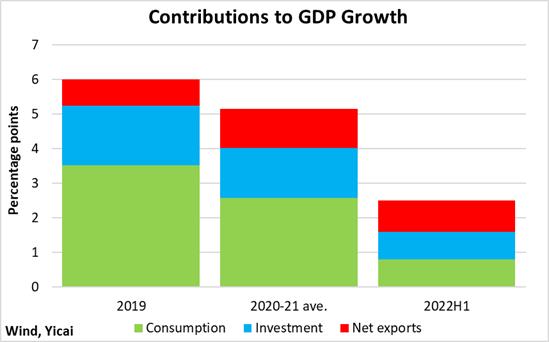
 (Yicai Global) Sept. 6 -- China’s GDP growth has slowed significantly this year. GDP grew by 6 percent in 2019 before the Covid pandemic hit. It averaged 5 percent over the pandemic-induced slowdown in 2020 and recovery in 2021. But, in the first half of this year, growth has only been 2½ percent (Figure 1).
Much of the slowdown in GDP growth has come from flagging consumption. Before the pandemic, consumption contributed some 60 percent to overall GDP growth. But it has only contributed one-third of the growth recorded in the first half of this year.
Figure 1
Fear of contracting Covid or bumping into someone who is a “close contact” of an infected person are weighing on the consumption of services, especially those that involve a high degree of close human contact, like travel and dining out.
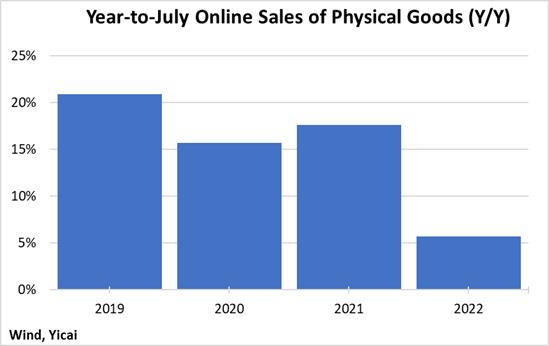
However, even purchases that require very little human contact have been relatively weak. For example, online sales of physical goods only grew by 6 percent, year-over-year, from January to July. This is down from an average of 18 percent for the same period in the three previous years (Figure 2). The risk of infection from online shopping is fairly low, so what other factors could be restraining consumption?
Figure 2
Surveys provide potentially useful insights into why consumers are reluctant to spend.
To get an idea of what shoppers might be thinking, we turn to the surveys conducted by RIWI (riwi.com), which uses patented, machine-learning technology to reach the broadest possible set of respondents.
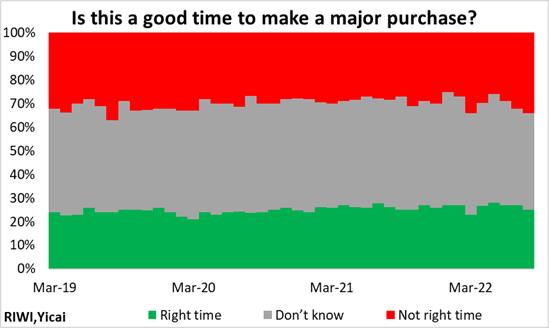
RIWI asks survey respondents if it is or is not currently a good time financially to make a major purchase, like a car or a TV.
Its results match up well with the ’s own survey of urban depositors. The People’s Bank asks respondents if they plan to increase their consumption, their investments or their savings.
I have graphed the percentage of RIWI’s respondents that say now is a good time to spend against the share of the People’s Bank respondents that say they will increase consumption (Figure 3). In both surveys, about a quarter of respondents, on average, indicate a willingness to consume more. The trends of the two series are similar. They both fall in the first quarter of 2020, during the pandemic’s first outbreak and then recover. The RIWI series makes a somewhat stronger recovery.
RIWI’s survey is done in real time, so I have been able to provide their results for the third quarter-to-date, which indicates that consumption intentions ticked down.
Figure 3
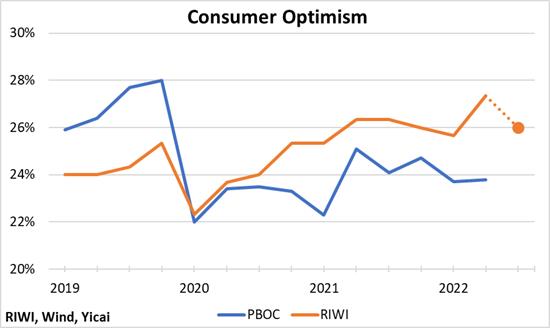
Figure 4 shows all of the responses to RIWI’s question. The share of those that think it “is” a good time to buy is relatively stable compared to that of those that think it “is not”. So, focusing only on those that think it “is” a good time might cause us to ignore potentially important information about consumers’ intentions.
Figure 4
To squeeze all of the information out of RIWI’s survey responses, we create a “balance of sentiment” measure which subtracts the pessimistic responses from the optimistic ones (Figure 5). Focusing on the last 20 months, we can see that sentiment declined sharply in March 2022. It turned positive in May but became increasingly negative thereafter. This measure of consumer sentiment does not appear to be correlated with the trend in Covid cases.
Figure 5
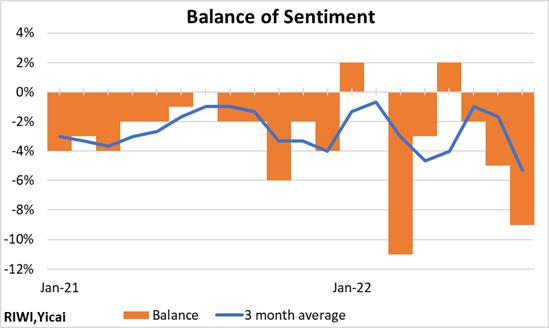
If Covid is not driving consumer sentiment, what other factors might be responsible?
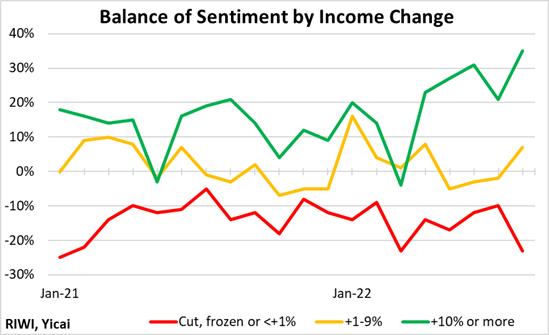
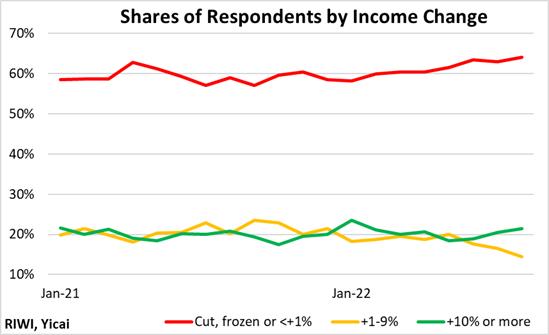
Economic theory suggests a tight relationship between income and consumption. Fortunately, RIWI also asks its respondents how their incomes changed in the last year. This allows us to look at the balance of sentiment by income growth. We divide the respondents into three groups: (i) those whose incomes rose by 10 percent or more, (ii) those whose incomes rose between 1-9 percent and (iii) those whose incomes either fell, did not change, or rose by less than one percent. The third group accounted for 60 percent of the respondents, with each of the other two groups representing 20 percent.
Figure 6 shows that there are very large differences in the balance of sentiment among the income groups. Between January 2021 and August 2022, the balance of sentiment of the slowest growing income group averaged -14 percent. Predictably, members of this group were unlikely to make a major purchase. That of the 1-9 percent income group averaged +2 percent. They were about equally likely to buy or not buy. The balance of sentiment of the group whose income grew by 10 percent or more averaged 16 percent. They were relatively likely to buy a major item.
Looking at the groups over time, there is little evidence of the deterioration in overall sentiment seen in the last few months. Indeed, the sentiment of the fastest-growing income group has been rising. Those of the other two groups do not show an obvious trend.
Figure 6
It appears that the recent deterioration of sentiment is driven by changes in the composition of the sample. Figure 7 shows the share of each of the three groups in the overall sample. The share of the group whose income grew most slowly increased by 6 percentage points between January and August 2022. Since the balance of sentiment for this group is so much lower than those of the other two, a rise in its share reduces the overall average.
Figure 7
To the extent that the value of one’s home is considered wealth, changes in home prices could influence consumption decisions. Luckily, RIWI asks its respondents to estimate by how much the price of their homes has changed in the last year. We divide the respondents into two groups. The first, about a sixth of the sample, saw their home prices rise by more than 10 percent. The second, about an eighth of the sample reported a fall in the prices of their homes.
Unsurprisingly, there is a large difference in balance of sentiment between the two groups (Figure 8). For the group whose home prices rose by more than 10 percent the balance of sentiment averaged 6 percent over the last 20 months. For the group whose home prices fell, it averaged -4 percent and was very volatile.
Figure 8
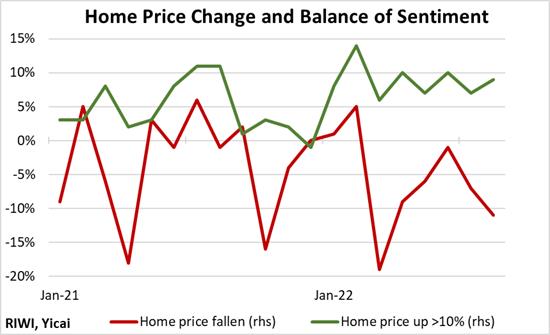
The balance of sentiment of the group whose home prices increased by more than 10 percent has trended up this year, while that of the group whose home prices fell has drifted lower.
As was the case for income growth, the evolution of the composition of these two groups matters (Figure 9). In the first quarter of 2021, those whose home prices fell made up 39 percent of the two groups. But that share has been increasing and it rose to 51 percent over the last three months.
Figure 9
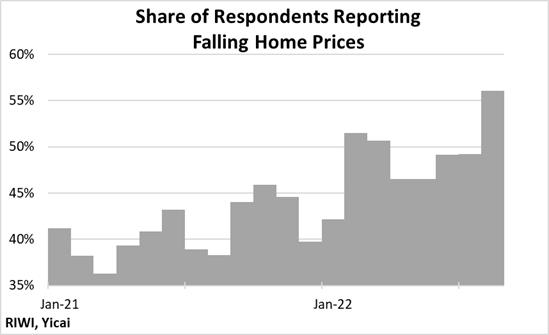
While the RIWI survey results suggest that the weakness in the property market is likely to be affecting consumption, I do not believe that this argues for policies that support the price of housing. The fact remains that residential real estate, relative to incomes, is very expensive in China.
As Figure 6 above shows, the policy takeaway from RIWI’s survey ought to be that raising incomes will have a large effect on the desire to consume. Raising incomes in a sustainable way involves giving workers better tools (physical capital), enhancing their training (human capital) and improving the ways in which their work is organized (total factor productivity). Developing the supply side of the economy in this way should progress slowly and steadily over time. Policy should ensure that cyclical concerns do not derail these advancements.