 How Innovative Is China?
(Yicai) Jan. 2 -- For economists, it is axiomatic that innovation is the single most important factor in determining a country’s long-term prosperity. Those who have studied the American experience found that increases in capital and labour only accounted for a small fraction of the growth of US GDP. Most of the increase in GDP remains unexplained – the so-called Solow Residual – and it is attributed to the higher productivity that results from innovation.
Since the Party’s 18th National Congress in November 2012, China’s leadership has made innovation the centerpiece of the country's economic development. A decade later, innovation is no less important. During this year’s Two Sessions, President Xi emphasized the need to accelerate the implementation of China’s innovation-driven development strategy.
The 2023 edition of the Global Innovation Index (GII) provides a good perspective on the progress China has made since the 18th National Congress.
The GII was launched in 2007 to identify metrics to paint a comprehensive picture of innovation within an economy. Originally created by the Institut Européen d'Administration des Affaires (a graduate business school) and World Business (a British periodical), the GII is currently produced by the World Intellectual Property Organization (WIPO).
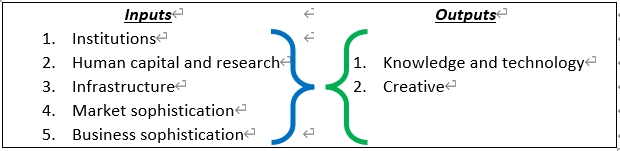
The GII organizes 80 indicators into five input pillars and two output pillars (Table 1).
The five input pillars are designed to capture the elements of an economy that enable innovative activities. The idea is that today’s innovation inputs facilitate the creation of tomorrow’s innovation outputs. The innovation outputs capture the current state of innovative activities within an economy. An economy’s Innovation Score is the average of the five inputs, on the one hand, and the two outputs, on the other. This means that the output indicators have a relatively higher weight in the Innovation Score.
Table 1
Structure of the Global Innovation Index
Given the comprehensive scope of its data, it comes as no surprise that countries find the GII useful. A survey conducted by WIPO in 2022 showed that 70 percent of its member-countries were using the GII as a benchmark for their innovation policies and to improve national innovation ecosystems and metrics.
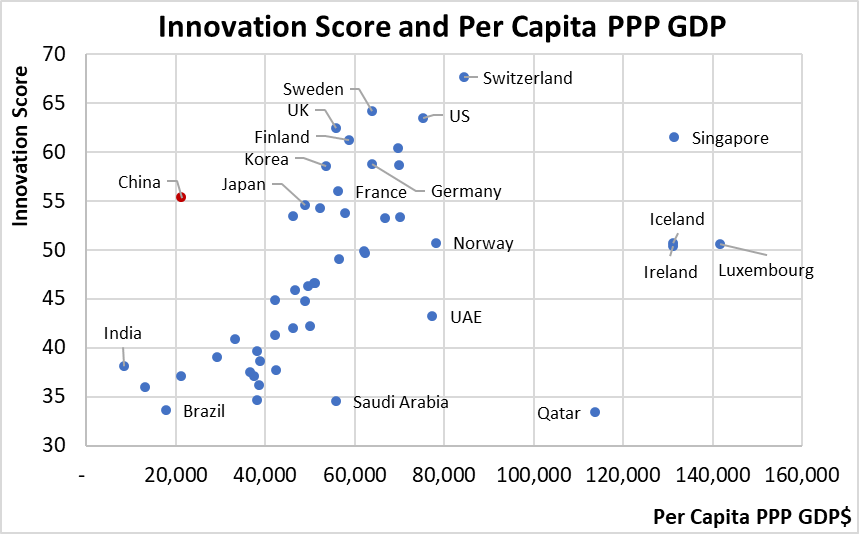
At first glance, there appears to be little relation between how innovative and how rich a country is.
Figure 1 presents a scatterplot of the 50 economies with the highest Innovation Scores and their per capita GDPs. The lack of apparent correlation seems to be the result of seven outliers. There are three economies – the UAE, Saudi Arabia and Qatar – whose income derives principally from their ability to produce petroleum products. An additional three economies – Singapore, Luxemburg and Iceland – are too small to be representative of the typical country. Ireland is also a special case given its extremely high rate of foreign direct investment. According to the Irish government, its GDP could be overstating the true income of Irish residents by some 75 percent
If we eliminate these seven outliers, the correlation between the remaining 43 economies’ ability to innovate and their incomes is close to 80 percent.
China and India are also outliers. Their innovation scores are much higher than their per capita income levels would predict. China ranks 12th out of the 132 economies in the GII’s full sample. It lies between France and Japan. This is impressive considering that China’s per capita income is just over USD21,000 while those of its two closest neighbours are close to $53,000. Similarly, India with a per capita income of $8000, ranks 40th. It lies between Türkiye (USD39,000) and Poland (USD42,500).
Figure 1
To get a more nuanced picture of China’s innovation strengths and weaknesses, we can look at how it scores on each of the GII’s five input and two output pillars.
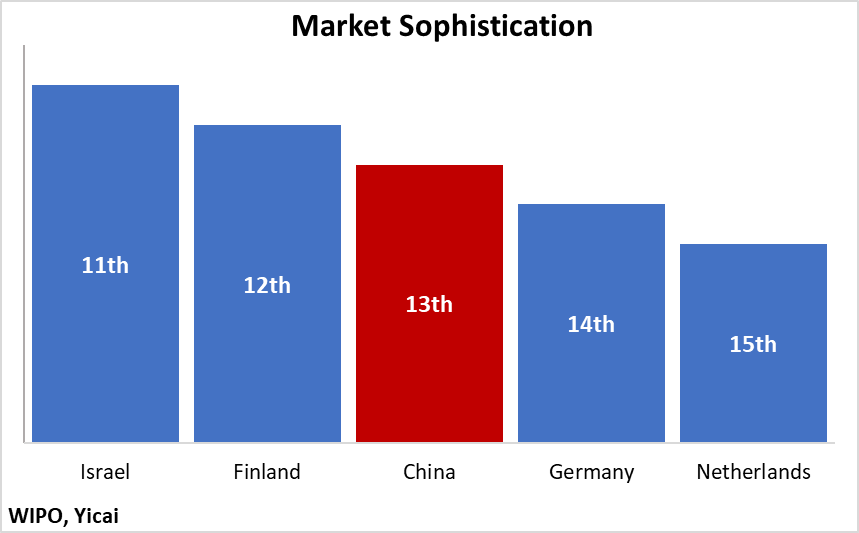
Across the input pillars, China ranks highest (13th) in market sophistication. It is in good company, between Finland and Germany (Figure 2). The GII uses ten indicators to gauge this pillar, which assesses credit availability, stock market and venture capital funding and international trade. China gets high marks for the scale of its domestic market and the diversification of its international trade. It loses points for the volume of credit for venture capital and for its rather high tariff rate on imports.
Figure 2
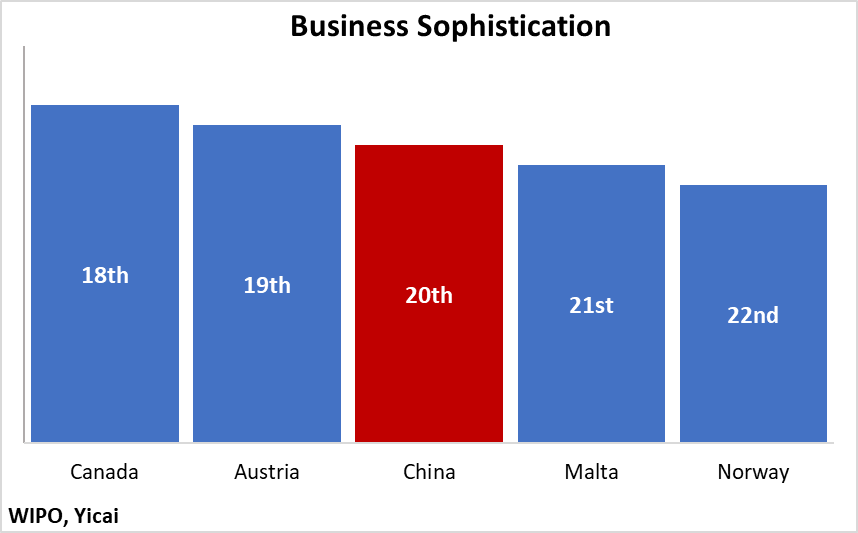
The GII uses fifteen indicators to measure business sophistication. China ranks 20th on this pillar, between Austria and Malta (Figure 3). It does well in terms of the quality of its industrial clusters, the amount of R&D performed by its businesses, the extent of R&D collaboration between universities and industry and the relatively large amount of high-tech imports. It does relatively poorly on attracting foreign direct investment and in eliciting foreign finance for R&D. China also imports relatively little in the way of ITC services.
Figure 3
China ranks 22nd on human capital and research, between New Zealand and Portugal (Figure 4). The GII uses twelve indicators to measure overall education, tertiary education and R&D. China does well on the performance of its students on standardized tests, the amount of R&D undertaken by its largest corporations and the high ranking of its top-three universities. It does poorly on expenditure on education as a percent of GDP, tertiary enrollment rates and its intake of foreign students.
Figure 4

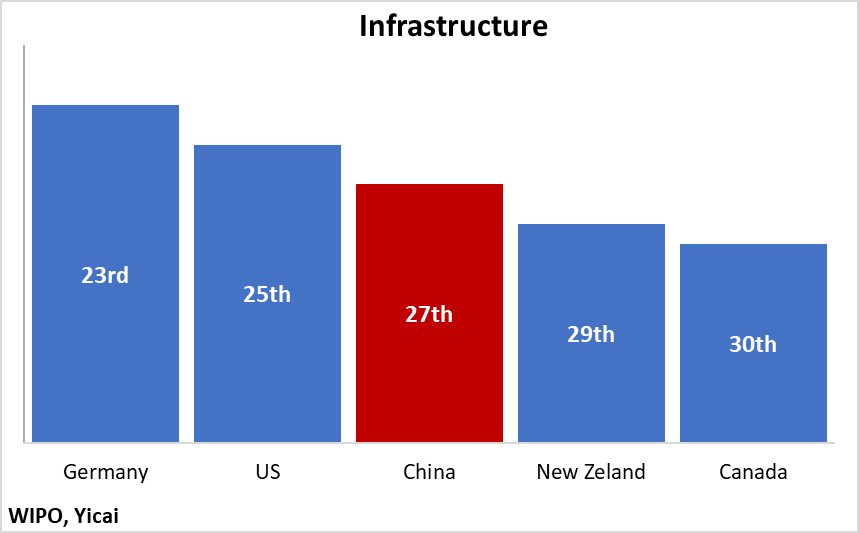
China ranks 27th in infrastructure, between the US and New Zealand (Figure 5). The GII uses ten indicators to assess information and communication technologies and ecological sustainability as well as general infrastructure. China does well on capital formation and its ISO14001 environment relative to its level of PPP GDP. It does poorly on the amount of energy needed to create one unit of GDP and on environmental performance.
Figure 5
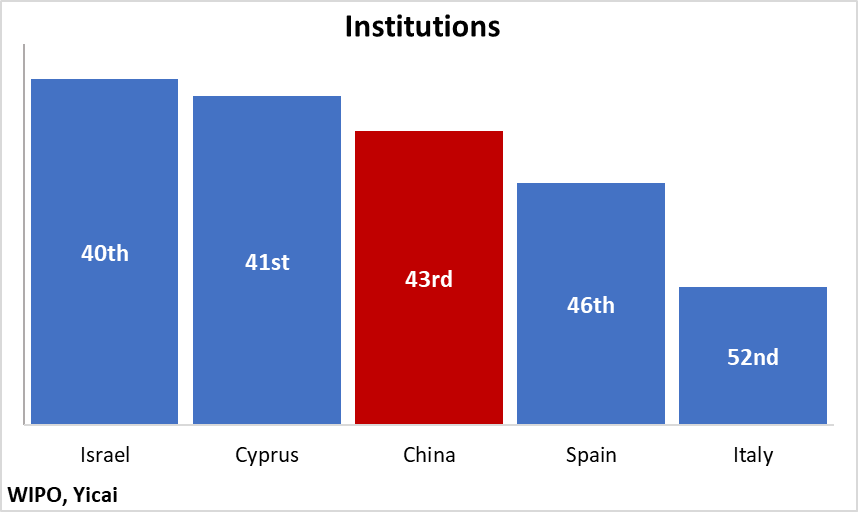
Across all of the seven pillars, China’s lowest ranking is on institutions (43rd), where it lies between Cyprus and Spain (Figure 6). China does quite well on entrepreneurship policies and culture and policies for doing business. However, it performs poorly on regulatory quality, the rule of law and the cost of dismissing workers.
Figure 6
China performs better on the output than the input indicators.
It ranks 6th in knowledge and technology outputs, between Israel and the UK (Figure 7). The GII uses 19 indicators to measure the creation, impact and diffusion of knowledge. China scores high for labour productivity growth, the creation of patents and the large share of high-tech items in its exports. It does relatively poorly in exporting ITC services, receiving international payments for its intellectual property and the amount of scientific and technical articles per unit PPP GDP.
Figure 7

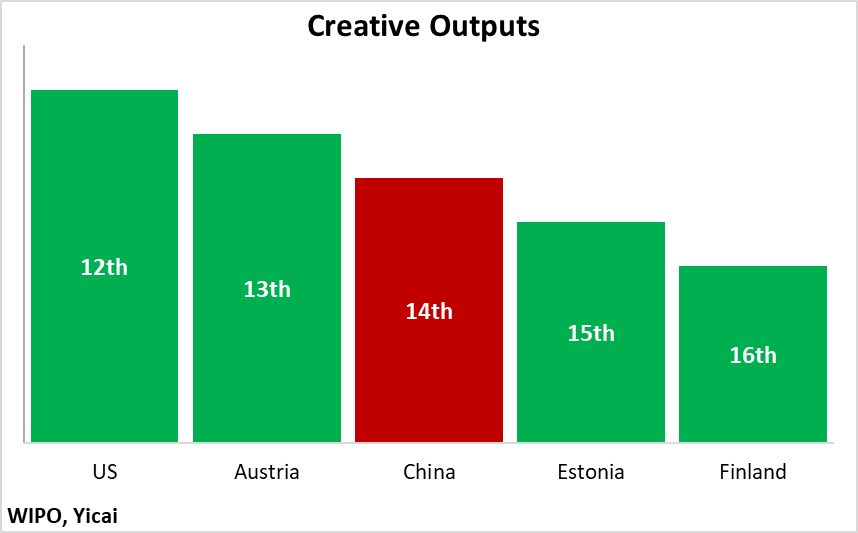
China ranks 14th in producing creative outputs, between Austria and Estonia (Figure 8). The GII uses 12 indicators to measure intangible assets, creative goods and services and online creativity. China is very good at creating trademarks and industrial designs, given its level of PPP GDP. It also has a high share of creative goods in its exports. However, it does relatively poorly in measures of online creativity and the number of feature films it produces, given its population.
Figure 8
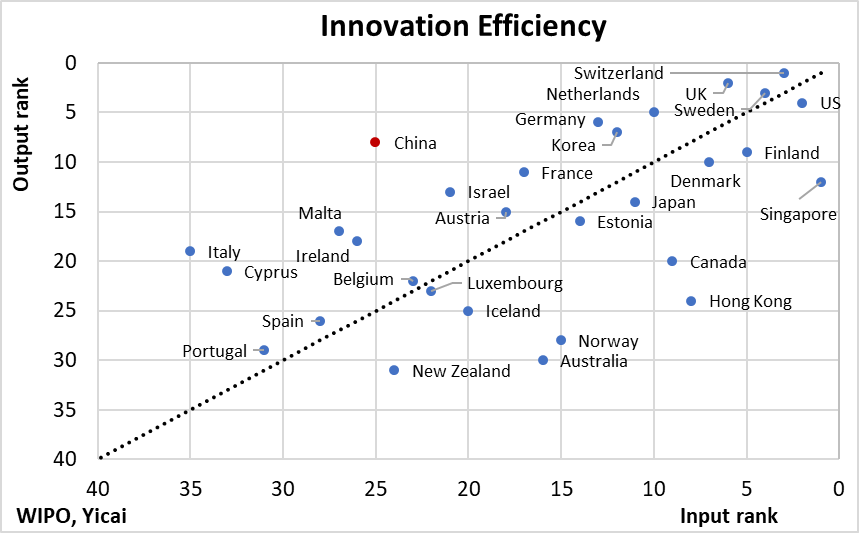
According to the GII, China uses its innovation resources quite efficiently. This can be seen from its output rank (8th) being much higher than its input rank (25th). Along with Italy, China is one of the few countries whose innovation outputs rank much higher than their inputs (Figure 9).
Figure 9
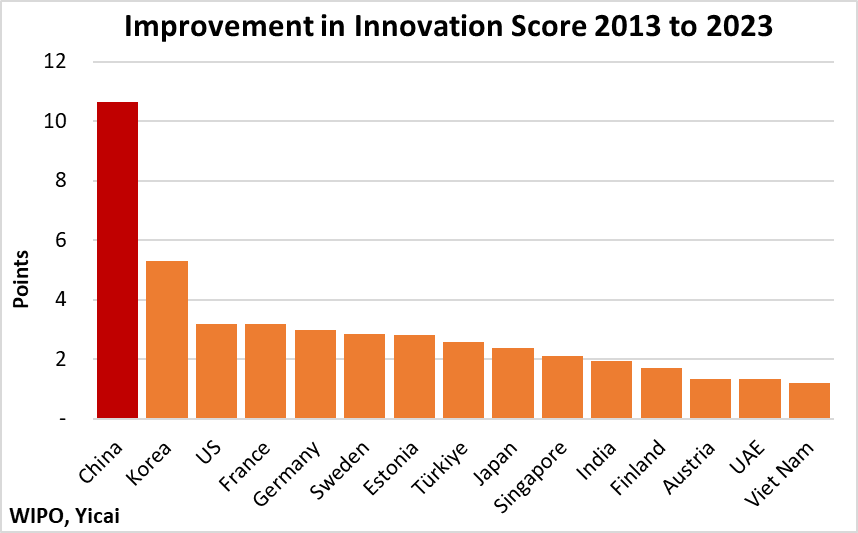
China also distinguishes itself for having made the largest improvement in its Innovation Score over the last decade. Figure 10 shows that its score improved by over 10 points between the 2013 and the 2023 editions of the GII. This was double the improvement of Korea, which had the second-best increase over the period. The average increase of the 3rd to 7th most-improved economies was only 3 points. As a result of this advance, China’s ranking rose from 35th to 12th.
Figure 10
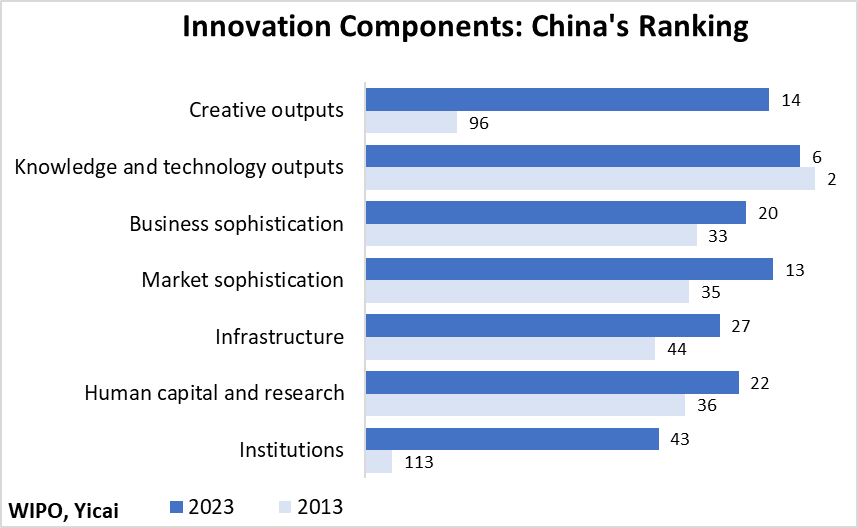
Over the last decade, China improved its ranking in 6 of GII’s 7 pillars (Figure 11).
The biggest gains were in the areas where China ranked lowest in 2013: creative outputs (96th to 14th) and institutions (113th to 43rd). Despite increasing its score, China’s ranking in knowledge and technology outputs slipped from 2nd to 6th.
Figure 11
Three key points summarize the GII’s data.
First, China is a very creative economy whose international ranking is much higher than one would expect given the level of its per capita GDP. Second, China uses its innovation inputs very efficiently: it is able to achieve a relatively high level of innovation outputs given these inputs. Third, looking back over the last ten years, China has made a much greater improvement in its Innovation Score than any other economy.
GII’s data suggest that – while there are certainly areas for improvement – the economy is clearly evolving from "Made in China" to "Created in China".
 Mark KrugerBased in Shanghai, Mark Kruger holds Senior Fellow appointments at the Yicai Research Institute, the Centre for International Governance Innovation and University of Alberta’s China Institute. Between 2020 and 2023, Mark was the Opinion Editor at Yicai Global. Previously, he had a 30-year career with the Bank of Canada in the course of which he served as a Senior Advisor to the Canadian Executive Director at the IMF and the head of the Economic and Financial Section of the Canadian Embassy in Beijing.