 China’s Recovery Accelerated in October
(Yicai) Nov. 21 -- Despite the downturn in the property market and falling exports, the data by the National Bureau of Statistics (NBS) on November 15 showed that China’s economy was able to maintain solid growth in October.
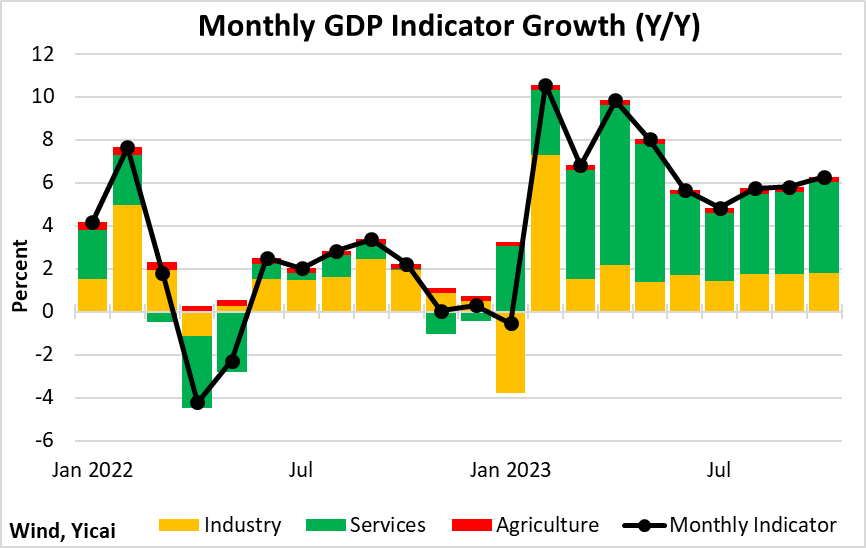
Our monthly proxy for GDP points to 6.3 percent growth in October, up from 5.8 percent in both August and September. Some of the acceleration in GDP growth is due to a weaker base, as our estimate for GDP growth in October 2022 was relatively weak (Figure 1).
Figure 1
No model is perfect.
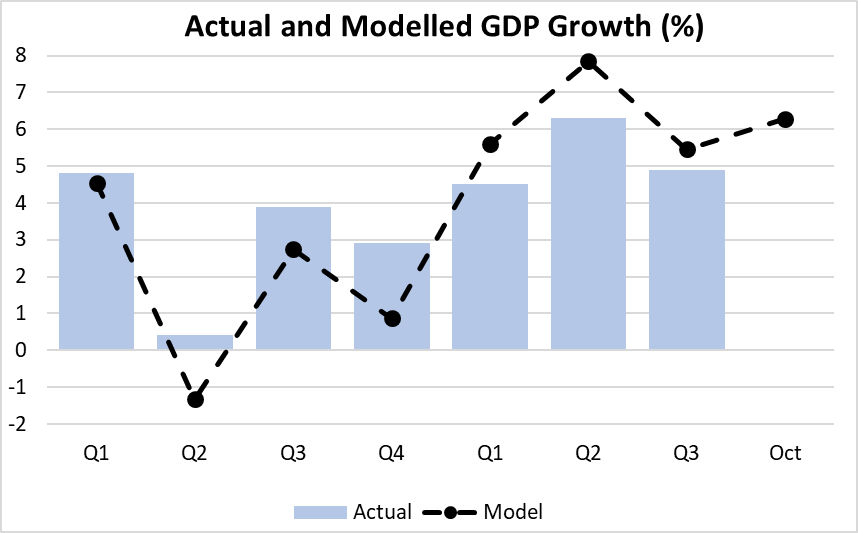
Our monthly indicator model under-estimated the actual growth of GDP in 2022 by just over a percentage point. This year, the model turned optimistic and has over-predicted GDP growth by a similar amount, on average, over the first three quarters (Figure 2).
Taking this over-prediction into account, GDP growth for the year as a whole would come in at 5.6 percent should October’s momentum be maintained for the rest of the quarter. This would be in line with, or even slightly stronger than, the government’s target of “around 5 percent.”
Given the severity of the property market and export shocks, it is not a bad outcome and speaks to the resilience of the rest of the economy.
Figure 2
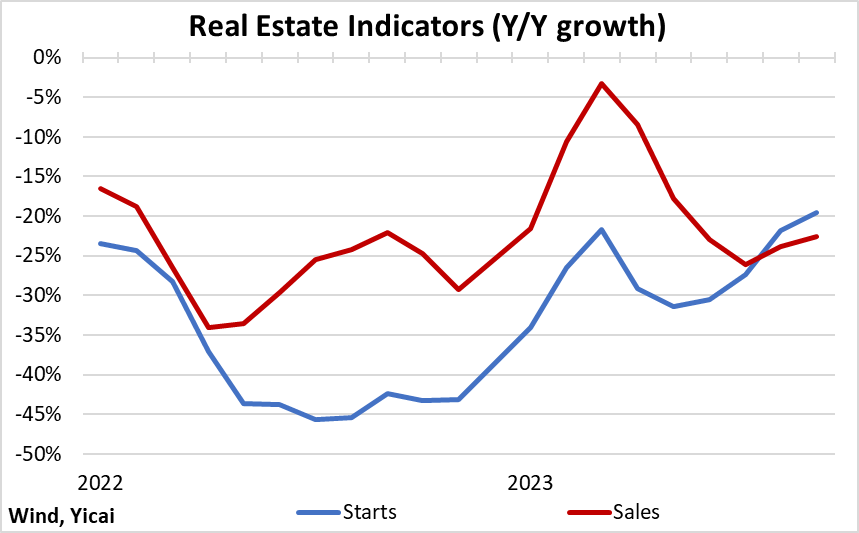
After a false recovery earlier this year, the volume of new residential real estate sales in October remained more than 20 percent below last year’s levels (Figure 3).
Since new apartments are typically purchased before they are constructed, buyers are wary of committing their funds as long as developers’ financial situation appears precarious. The bad news has not subsided. Most recently, investors have soured on the bonds issued by , one of China’s largest developers, as they worry that it could follow in the footsteps of Evergrande and Country Garden. It is unlikely that Vanke will fail. The city of Shenzhen pledged to support Vanke buy injecting fresh liquidity, puchasing its bonds and taking over some of its urban renewal projects. Shenzhen is Vanke’s largest shareholder.
As long as homebuyers’ caution persists, the prospect for a recovery in housing starts remains dim.
Figure 3
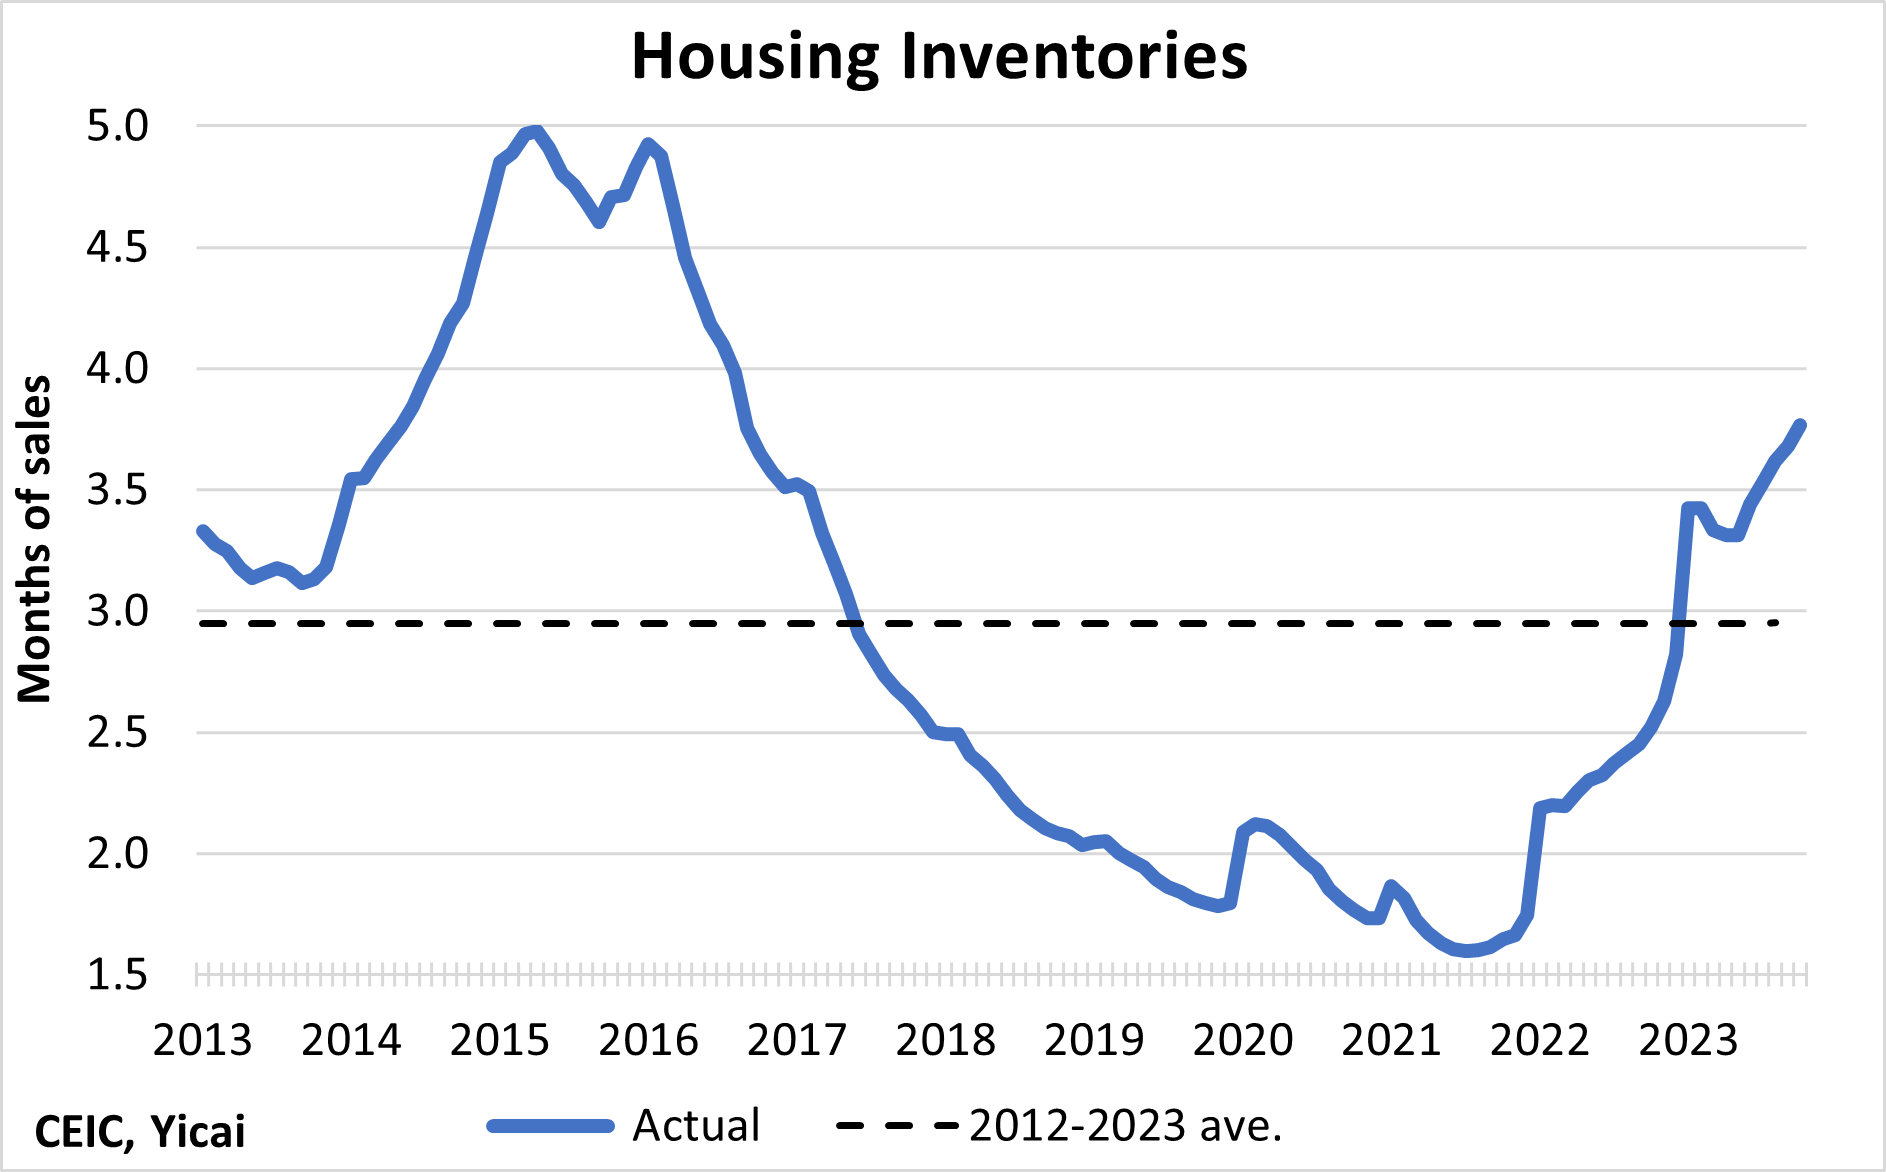
Local governments have focused their efforts on helping developers complete existing projects. In fact, the volume of completed apartments was actually up 14 percent in October. More completions and fewer sales have led to a rise in inventories. Unoccupied apartments stood at 3.8 months of sales in October, well above their 11-year average (Figure 4).
Figure 4
As the imbalance between the demand for and supply of housing grows, it is not surprising that home prices remain under pressure.
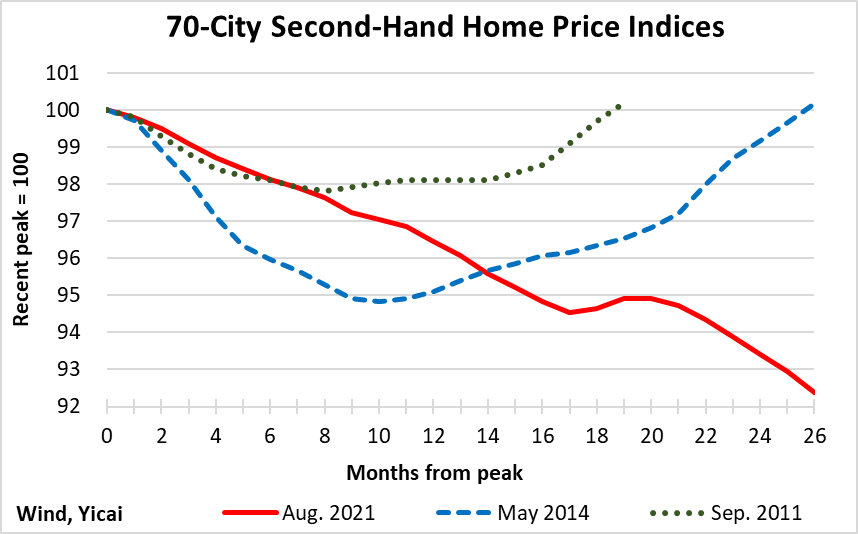
In the two previous housing cycles, it took close to two years for second-hand home prices to regain their previous peaks (Figure 5). However, the NBS’s data for China’s 70 largest cities show that, during this cycle, prices have not yet bottomed out.
Figure 5
The NBS reports that prices in first-tier cities are only down 3 percent from their April peak. But, here in the Tangqiao district of Shanghai, the fall in prices has been sharper. Judging from real estate agents’ websites, the price of my apartment is down about 13 percent from its recent high. Notwithstanding this decline, it is still close to three times what my wife and I paid for it in 2012.
The actual numbers will vary from household to household but it is likely the case that most Chinese families are still sitting on large unrealized capital gains. So, I do not think that the price declines we have seen so far will have much of an effect on consumer spending.
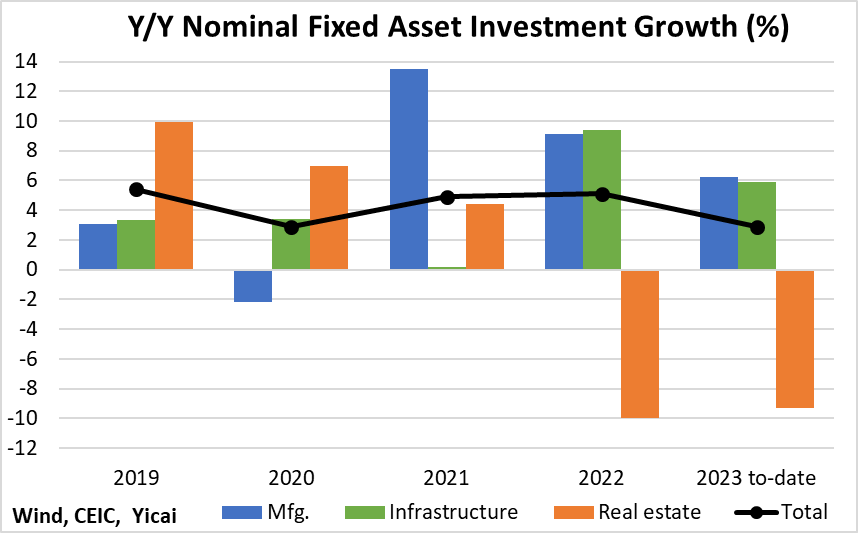
Investment in real estate development is down 9 percent in the year to October, a similar decline to the one recorded in 2022 (Figure 6). Overall fixed asset investment is up a modest 3 percent, compared to 5 percent growth in 2022.
Figure 6
In the last two years, the government has sought to replace the lost investment demand due to real estate weakness by boosting infrastructure spending.
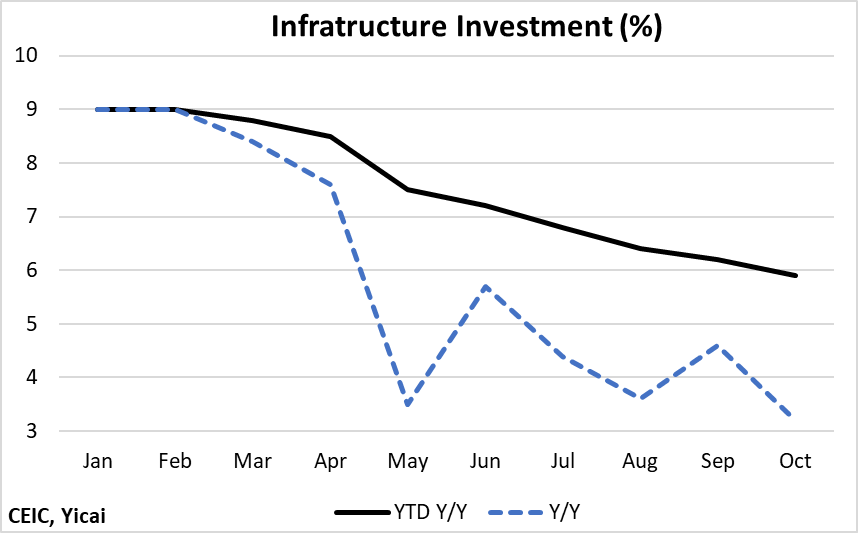
Much of the infrastructure spending is financed by local governments and their revenues have been hit hard by falling land sales. As a result, the growth of infrastructure spending has slowed from 9 percent year-over-year in January to an estimated 3 percent in October (Figure 7).
The central government recently announced that it will issue in new bonds to finance continued infrastructure spending. While this only represents 5 percent of last year’s investment in infrastructure, the central government hopes that by providing this “seed capital” it will be able to lever four times as much new infrastructure lending from financial institutions.
Figure 7
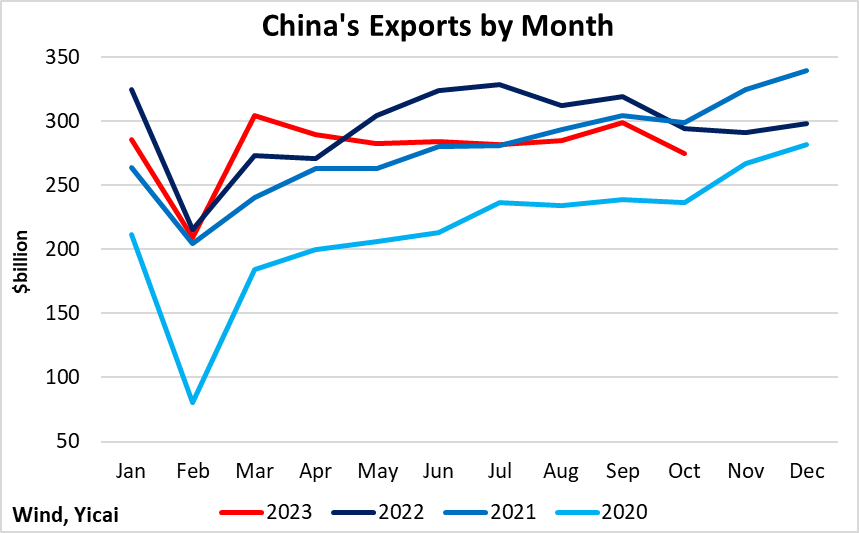
China’s exports fell in 11 of the last 13 months (Figure 8). The key question here is whether this decline is due to a loss of competitiveness, a lack of demand or the effect of the US’s tariffs.
The tariffs, which were imposed in 2018, definitely do seem to be playing a role. China’s share of US imports has fallen from a peak of 22 percent in early 2018 to 15 percent most recently. Under a counterfactual where China maintains its peak market share in the US, its global exports over the last 12 months would be about 8 percent higher. That is more than enough to cover the actual 5 percent fall in exports from the previous 12-month period.
Figure 8
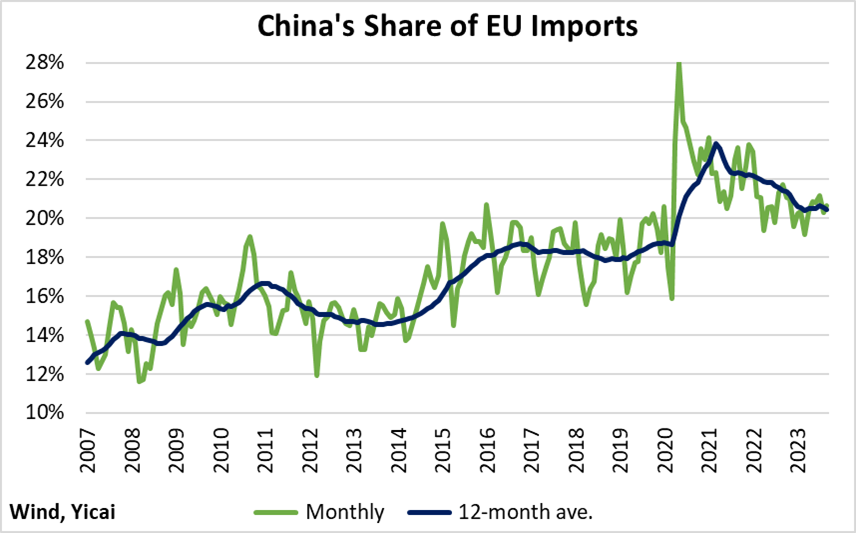
In the EU, where it has not faced discriminatory tariffs, China has been able to increase its share of total imports from 19 percent before the pandemic to 21 percent most recently. A 2 percentage point increase in import share over close to four years doesn’t sound like much. However, consider that in the twelve years between 2007 and 2019, China’s share of EU imports rose by 5 percentage points (Figure 9).
China’s exports to the EU were down 13 percent year-over-year in October. But the improving market share data suggest that this fall was the result of demand weakness rather than China’s lack of competitiveness.
Figure 9
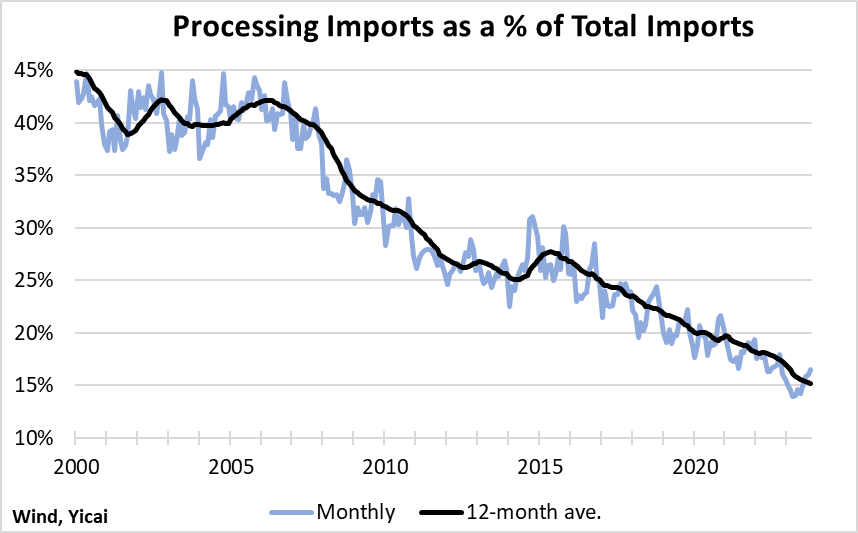
It is important to note that the domestic content of China’s exports is still rising.
China allows its domestic firms to import certain goods duty free if they are used as inputs for exports. Over time, these “processing imports” have fallen as a share of total imports. This suggests that Chinese firms are increasingly able to produce components that are good substitutes for those they used to buy abroad.
Notwithstanding this year’s export slowdown, processing imports continued their downward trend, falling to 15 percent from 18 percent a year earlier (Figure 10). Increasing the domestic value added of exports is one way to mitigate the effect of weak foreign demand on China’s production and employment.
Figure 10
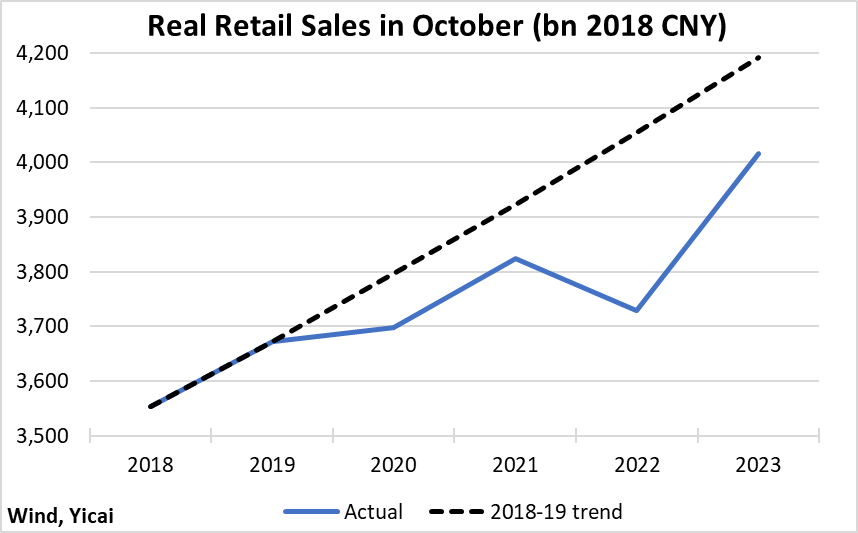
The Chinese consumer continued to shop in October.
Figure 11 presents inflation-adjusted retail sales for the month of October over the last six years. In real terms, retail sales were up close to 8 percent this year, but some of that rapid growth comes from the 3 percent decline in 2022. In October, retail sales were 4 percent below their 2018-19 trend, suggesting that there could still be some pent-up consumer demand. The gap had been 8 percent in October 2022.
Figure 11
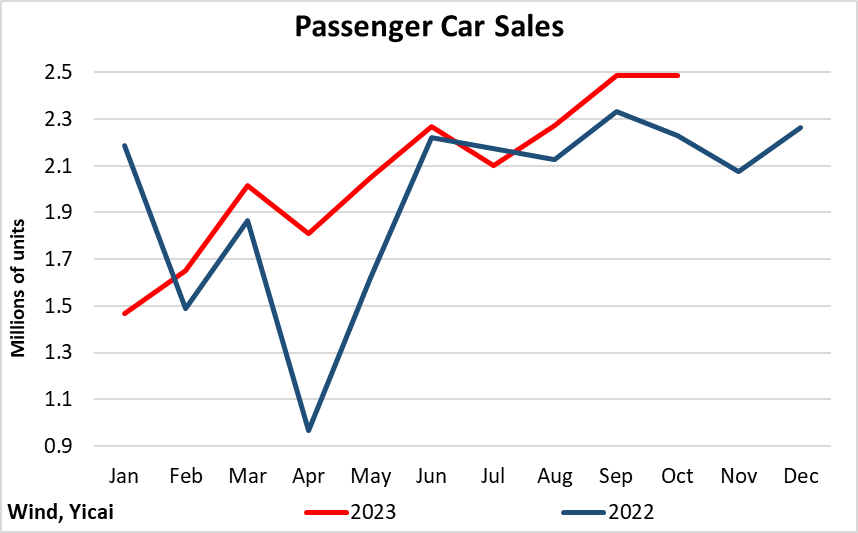
Sales of passenger cars remained robust in October, up 12 percent from a year earlier (Figure 12). Close to a million new energy vehicles were sold, up from 750,000 a year ago. Indeed, new energy vehicles accounted for almost all of the year-over-year increase in October’s passenger car sales.
Figure 12
I am encouraged by the recent between Presidents Biden and Xi.
While there are still many issues upon which the two countries differ, the presidents did reiterate the importance of ties between the Chinese and American peoples. They committed to increasing passenger flights and encouraged the expansion of educational, student, youth, cultural, sports, and business exchanges.
According to President Biden, while the US is competing with China, the world expects the two countries to “manage competition responsibly to prevent it from veering into conflict, confrontation, or a new Cold War.”
Hopefully, this meeting puts a floor under the deterioration in China-US relations and sets the stage for a return of confidence that will support both economies going forward.