 China’s Economy in November: Separating the Signal From the Noise
(Yicai) Dec. 20 -- The released by the National Bureau of Statistics (NBS) last week show that the recovery of China’s economy picked up steam in November.
Industrial value added grew by 6.6 percent year-over-year, up sharply from 4.6 percent in October. The outturn was significantly stronger than the 5.4 percent that the Chief Economists by the Yicai Research Institute expected. Similarly, retail sales accelerated from 7.6 percent year-over-year in October to 10.1 percent in November. The Chief Economists had forecast even stronger growth: 12.1 percent.
Our monthly GDP indicator, which uses the year-over-year growth of industrial value added, services production and an estimate for the agricultural sector points to growth of close to 8 percent in November, a marked acceleration from the rates observed in June through October (Figure 1).
Figure 1
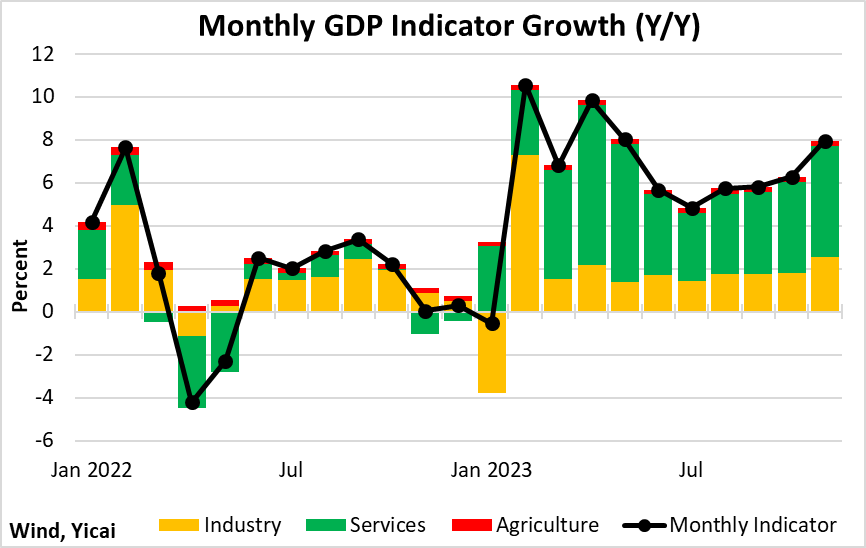
Some of the strength in November came from the weakness in the economy a year ago. For example, Figure 1 shows that our monthly GDP indicator barely grew in November 2022. This “weak base” inflates this November’s year-over-year growth rates.
What we want to do is look through this base effect – not only to estimate how fast the economy really grew in November but also to get a sense of the trend that can be carried forward into 2024. A good economist is one who can separate the trend from irrelevant temporary factors. In my experience, this is more an art than a science.
Fortunately, the NBS gives us the data we need to estimate the trend in industrial value added without the distortions that come from year-over-year comparisons.
Each month, the NBS releases the month-over-month growth rate of industrial value added. In November, it was 0.87 percent. We can construct an index of industrial value added by choosing some starting point, calling it “100” and then calculating the subsequent points from the monthly changes the NBS provides. Figure 2 shows the NBS’s monthly changes and what such an index looks like if we designate January 2022 as 100.
Figure 2

The first piece of information this index provides is growth over the 23-month period: 10 percent or roughly 5 percent per year. This is somewhat slower than industrial value added’s average growth over 2018-19 – 6.3 percent. This two-year average also includes the effect of the pandemic in 2022, so we really want to focus on this year’s data points.
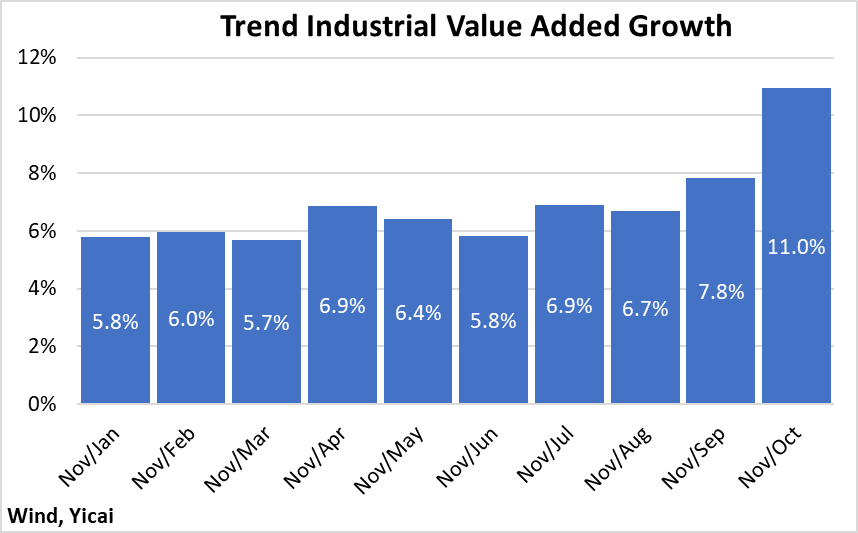
Figure 3 presents ten estimates of trend industrial value added growth solely based on 2023’s data. The November/January estimate comes from the annualized ratio of the index values for those two months. We annualize the ratio to account for there only being 10 months in this estimate rather than a full year. The 5.8 percent given by this 10-month estimate is slightly higher than the 5 percent from the index over the 23-month period. And it makes sense that industrial value added growth has been faster in 2023 than it was in 2022.
Figure 3 shows that if we shorten the period over which we calculate our trend to the more recent months, the growth rate picks up. The November/October growth rate is 11 percent, which is simply 0.87 percent annualized. Economists are fond of saying that “one data point does not make a trend” and it is unlikely that industrial value added will continue to grow at such elevated rates in 2024. Since it is the most recent data point, the November/October rate has some information about the future. Nevertheless, it is based on too short a period to be taken at face value.
So, what is the relevant trend in industrial value added?
This is where the art comes in. If we look at the average trend in the data from April through August, we get 6.5 percent. This period seems both long enough and recent enough to me. It suggests that the growth of industrial value added has fully returned to its pre-pandemic rate and provides a healthy starting point for 2024.
Figure 3
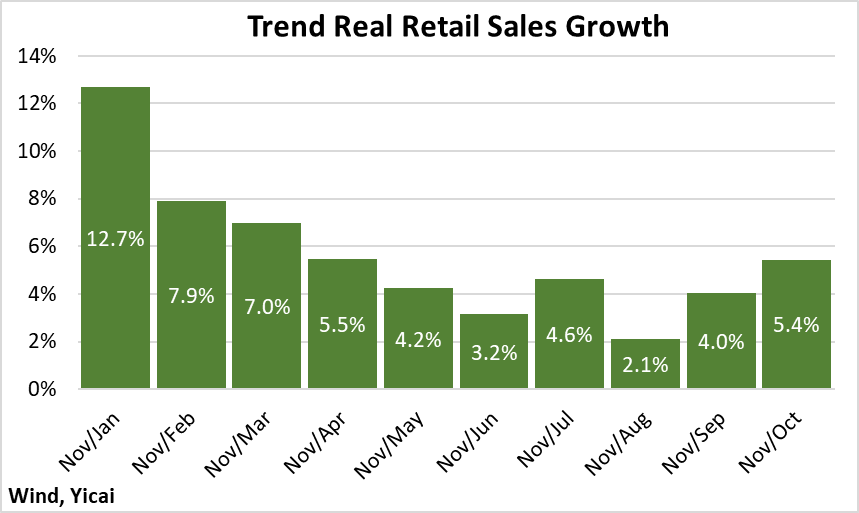
We can conduct a similar exercise for retail sales, for which the NBS also provides monthly changes. There is a small complication though. While the NBS’s industrial value added numbers are adjusted for inflation, its retail sales data are in nominal terms. I can correct for this by dividing the retail sales index by a similar one for consumer prices. The resulting inflation-adjusted changes and index are presented in Figure 4.
Figure 4

The index for real retail sales appears to move in discrete jumps and it is much less linear than that of industrial value added. This means that it will be more difficult to recognize the underlying trend.
If we again look to the average of the April-to-August estimates, we get 3.9 percent (Figure 5). This is lower than average real retail sales growth of 5.4 percent over 2018-19. It does make sense that retail sales growth remains below their pre-pandemic rates. The housing market is depressed and the sales of key items – like furniture and appliances – are linked to the purchase of new homes.
Thus, our analysis suggests that consumption has not yet fully recovered and that it will begin 2024 on a weakish note.
Figure 5
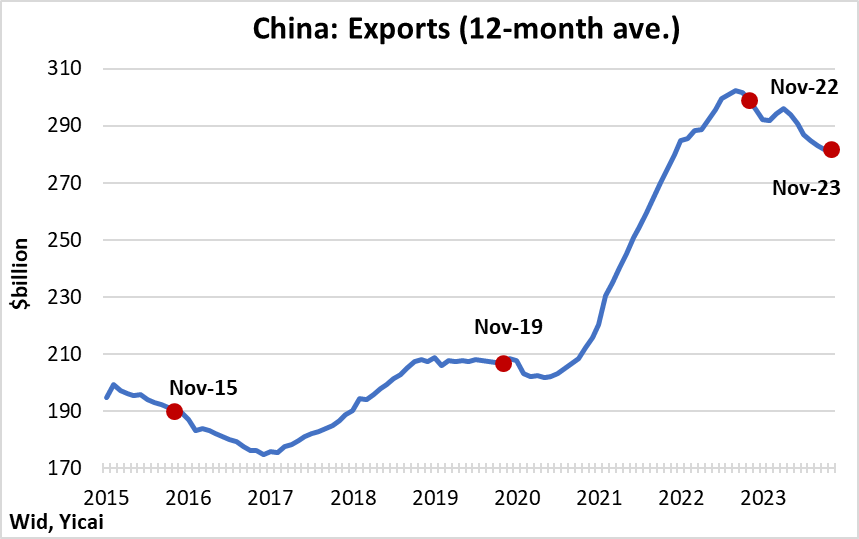
Exports and imports are among the most volatile economic time series. To get a better sense of its trends, the 12-month moving average of China’s exports is shown in Figure 6. This gets rid of the pronounced seasonality of these data as well as monthly aberrations.
On this basis, exports peaked at just over $300 billion in September 2022. Between November 2022 and November 2023, exports fell by 6 percent and this fall has weighed on GDP growth. However, too narrow a focus on developments in the last year may fail to recognize that this negative trend lies within a longer positive one.
There are three main reasons for China’s slowing exports. First, tight monetary policy in China’s major trading partners is restraining aggregate demand. Second, the tariffs imposed by the US are, over time, taking an increasing toll on China’s exports. Finally, during the pandemic, China’s exports were “pulled forward”. Since Covid affected China’s supply chains less acutely than those of other countries, Chinese exporters were able to fill the global supply shortfall. In the last year, some of China’s export surge has reversed as production in its trading partners has come back on stream.
Notwithstanding this reversal, exports in November 2023 were 36 percent higher than in November 2019. This works out to 8 percent average annual growth over this four-year period. Looking at the previous four-year period, from November 2015 to November 2019, China’s exports only grew by 9 percent, or at an average annual growth rate of 2 percent.
Figure 6
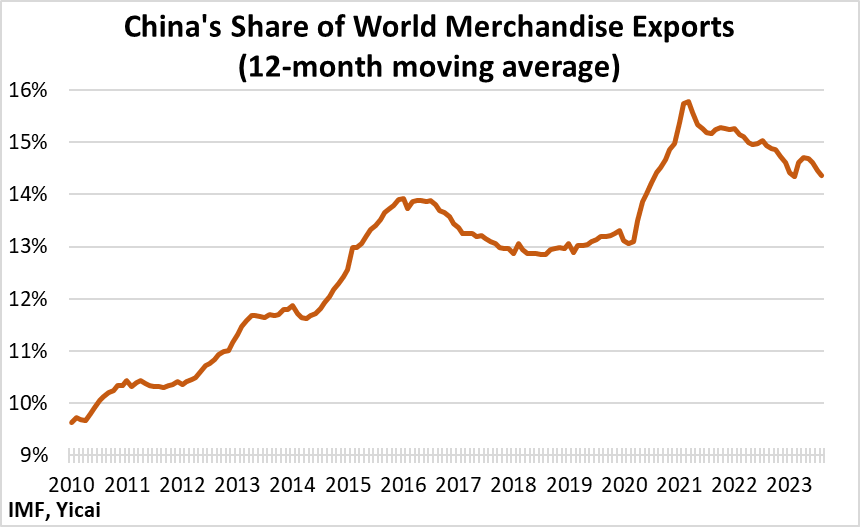
Another perspective on the performance of China’s exports comes from the IMF’s . These data are available to August 2023 and show that, despite the US’s tariffs and the correction of the “pull forward”, China’s share of global merchandise trade remains significantly higher than pre-pandemic levels (Figure 7).
Figure 7
How can we expect exports to perform in coming months?
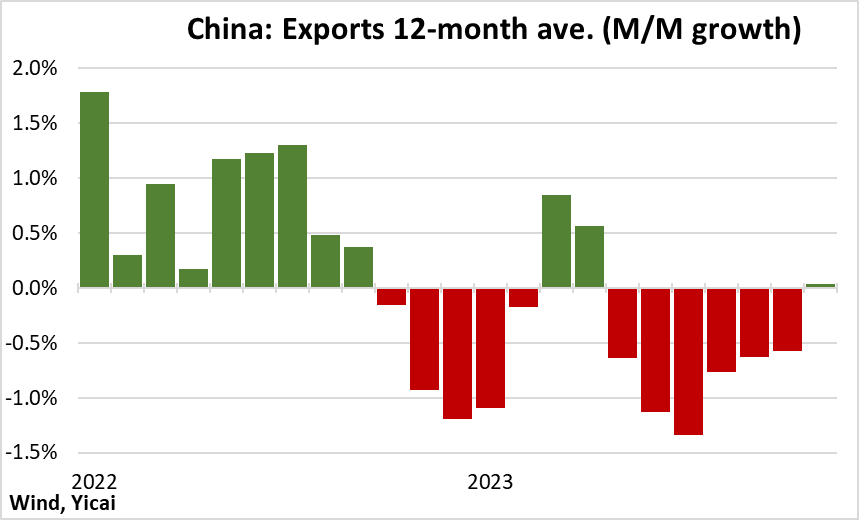
If we look at the month-over-month percent changes of the series in Figure 6, we see that since July 2023 they have grown less negative and turned (barely) positive in November (Figure 8). This points to some stabilization of exports as we enter 2024. The pivot of central banks away from higher interest rates should be supportive of consumption in China’s trading partners. Moreover, the recovery of those countries’ supply chains is complete and we should not expect a further displacement of China’s “pulled forward” exports.
Figure 8
Data can be a bit like Rorschach tests – those ink blots in which everyone sees something different. I have seen excellent economists argue about whether a data series was increasing or decreasing depending on what they saw as the relevant starting point and time period.
While some believe that November’s data paint a “” picture, I think that a careful look at the numbers indicates that, notwithstanding significant challenges, China’s economy is heading into 2024 in fairly decent shape.
 Mark KrugerBased in Shanghai, Mark Kruger holds Senior Fellow appointments at the Yicai Research Institute, the Centre for International Governance Innovation and University of Alberta’s China Institute. Between 2020 and 2023, Mark was the Opinion Editor at Yicai Global. Previously, he had a 30-year career with the Bank of Canada in the course of which he served as a Senior Advisor to the Canadian Executive Director at the IMF and the head of the Economic and Financial Section of the Canadian Embassy in Beijing.