 Are Central Banks Behind the Curve on Inflation?
(Yicai Global) May 25 -- The global economy has begun to recover from the ravages of the pandemic. Yet monetary policy remains very accommodative. Central banks continue to purchase massive amounts of financial assets and maintain rock-bottom interest rates.
Around the world, commodity prices, producer prices and consumer prices are all rising. Are we in for a bout of 1970’s style inflation?
Former US Treasury Secretary Larry Summers, one of the most vocal critics of lax monetary policy, has accused the Federal Reserve of “dangerous complacency”. He warns that once the Fed appreciates how entrenched the inflationary pressures are, it will be forced to raise interest rates sharply, imperiling both the recovery and financial stability.
When central banks consider how they ought to respond to rising prices, they first need to be clear about the source of the inflation. Broadly speaking, prices rise either because there is too much demand or because there is insufficient supply. Monetary policy is an effective demand management tool, but changes in monetary conditions have relatively little impact on the supply side of the economy. At any given time, a complex mix of demand and supply factors are usually at play and central banks need to weigh numerous pros and cons before they act.
It appears that the price pressures we are currently seeing are largely the result of supply constraints. While demand certainly is recovering, and prices are rising, it is likely that inflation will moderate as more supply comes on stream.
The IMF’s April World Economic Outlook provides a bird’s eye view of the global economy (Figure 1). Demand does not appear to be particularly strong. The level of global GDP this year is only expected surpass 2019’s by 2.6 percent. Annual growth of 1.3 percent, over 2020-21, is well below the 3.4 percent the global economy registered between 2014-19.
Figure 1
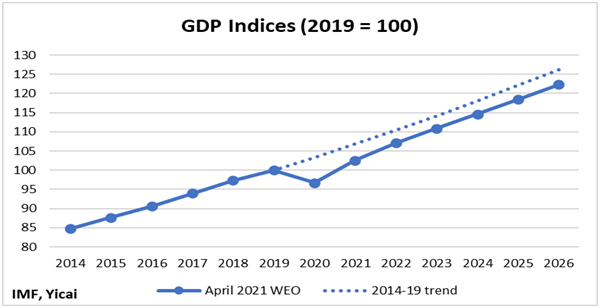
The Fund expects that the level of GDP this year will be 4 percent lower than the pre-pandemic trend. This gap narrows to 3 percent but it persists to 2026, implying that the pandemic left significant scars on global supply.
While there is little evidence of overheating at the global level, the picture becomes more nuanced if we differentiate between services and goods. While there are encouraging signs that the rollout of vaccines is beginning to contain the spread of the virus, fear of infection and public health measures have depressed the demand for and the supply of services.
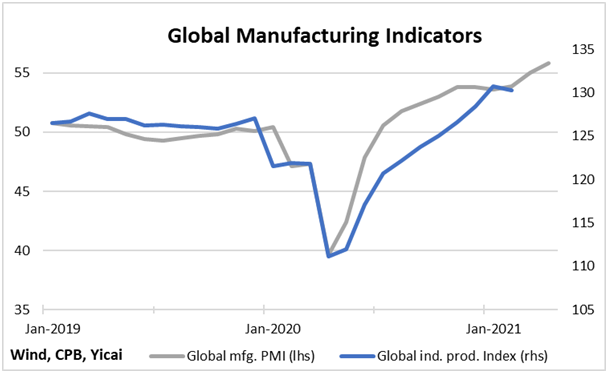
In contrast, the manufacturing sector is picking up (Figure 2). Global industrial production in January and February was about 3 percent higher than the same period in 2019. This represents an acceleration from December 2019, when the two-year growth rate was 2.2 percent.
The global manufacturing Purchasing Managers’ Index, which is available through April, suggests that goods production around the world remained strong in the spring.
Figure 2
While factories are humming, the oilwells and mines that supply them with inputs have responded less nimbly. This has led to a sharp rise in the prices of primary commodities, which has fed inflationary fears. However, it appears that commodity producers are resolving their supply constraints and that prices should stabilize later this year.
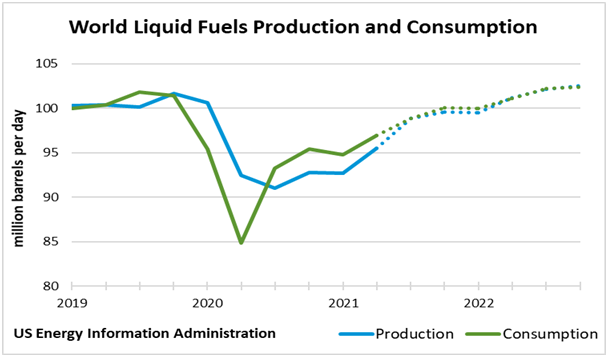
This dynamic is, perhaps, most clearly seen in the global oil market. Figure 3 shows that the consumption of liquid fuels dropped sharply in early 2020. To balance the market, the OPEC+ oil producing countries agreed to cut production by 9.7 million barrels per day, close to 10 percent of global consumption. More recently, the increase in consumption has outstripped that of production and prices have begun to rise. At their April 1 meeting, OPEC+ agreed to reduce the cuts to 5.8 million barrels per day for the May to July period. Analysts expect that the global oil market will essentially be back in balance by year end.
Figure 3
A similar story can be told for iron ore and copper (Figure 4), commodities whose prices have risen sharply in recent months. Iron ore production dropped last year due to a dam bursting in Brazil and mine auction delays in India. This year, supply is expected to be 2 percent higher than the pre-pandemic level, followed by 4 percent growth to 2024.
Figure 4
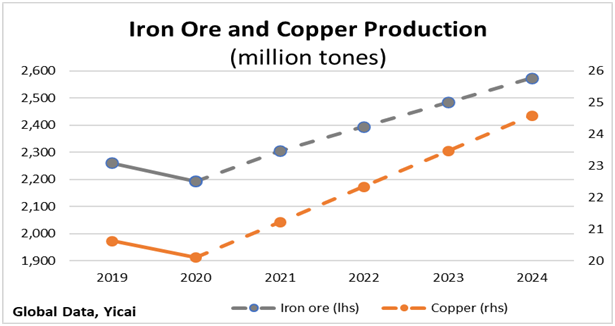
The production of copper fell in 2020, as COVID-related restrictions disrupted supply in Chile and Peru. Production this year should exceed 2019’s by 3 percent and then grow by 5 percent annually to 2024.
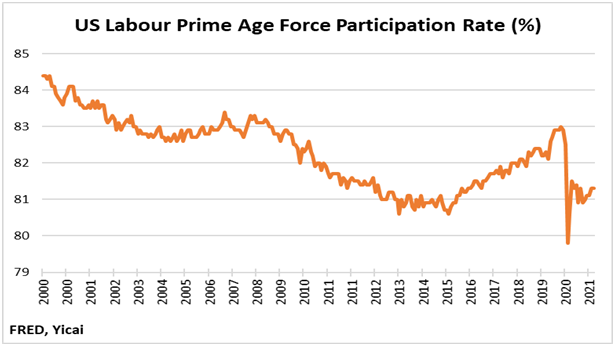
Supply constraints are also playing a role in US labour markets. Figure 5 presents the labour force participation rate for prime-age workers (those between 25 and 54). It shows that a significant share of prime-age workers left the labour force in early 2020. While some have returned, many have chosen not to look for work. The fear of becoming infected, an inability to find child care and the availability of extended unemployment benefits are cited as reasons for the US’s worker shortage and rising wages.
Figure 5
Supply constraints can affect prices in unexpected ways. There is currently a global shortage of computer chips. This is a confluence of many factors including a pandemic-induced demand for laptops, cellphones and game consoles and supply constraints such as a fire halting production in a Japanese chip factory, unseasonably cold weather shutting down plants in Texas, and droughts in Taiwan.
Computer chips are an important input into the production of cars, where they are used for brake, power steering, information and entertainment systems. The chip shortage has resulted in reduced new car production. This, in turn, led US consumers to buy an unusually large number of used cars. Used car prices were up 21 percent, year-over-year, in April.
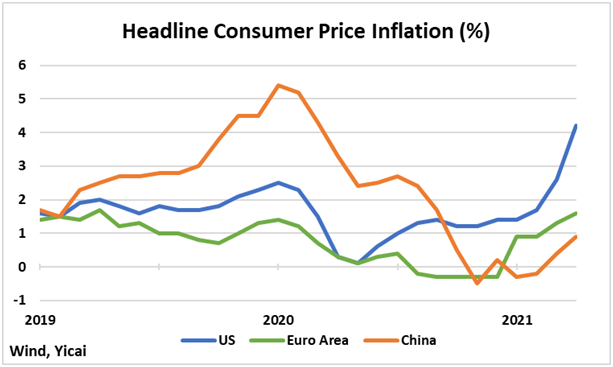
Most central banks monitor commodity and producer price markets closely but are focused on ensuring stable consumer prices. In China, producer price inflation rose to 6.8 percent in April, the highest reading since October 2017. Still, consumer prices remain well-behaved with headline and core (ex-food and energy) inflation only 0.9 and 0.7 percent, respectively. Indeed, headline consumer price inflation remains well below the rates seen in early 2020, when the African swine fever ravaged the pig herd and drove up pork prices (Figure 6).
April consumer prices in the Euro Area rose at their fastest rate since November 2018. But, at 1.6 percent, do not seem like a cause for concern.
Consumer price Inflation appears more problematic in the US, where it jumped to 4.2 percent in April, the fastest rate since September 2008. Stripping out the volatile food and energy components, core inflation only rose by 3.0 percent. Core inflation was inflated by the “base effect”, which comes from the fall in the level of core prices in April 2020. The base effect contributed 0.6 percentage points. The contribution of higher used car prices is worth another 0.6 percentage points. This leaves “underlying” inflation at 1.8 percent, which does not appear to be excessive.
Figure 6
The calculation a central bank has to make is a difficult one, as it must weigh information that often points in different directions. Moreover, monetary policy has to be forward looking and think about where inflation is going as well as its recent causes.
The manufacturing sector is recovering quickly and this is causing shortages in those parts of the supply chain that can only respond slowly. Rising prices are part of this process. Monetary policy is a blunt instrument and it does not seem appropriate to use it to cool the manufacturing sector while the service sector remains weak.
While global interest rates will have to rise over time, it is important for central banks to be patient, monitor the process of the supply constraints working themselves out and communicate clearly with the public.