 What Explains This Year’s Rebound in China’s Overseas Direct Investment?
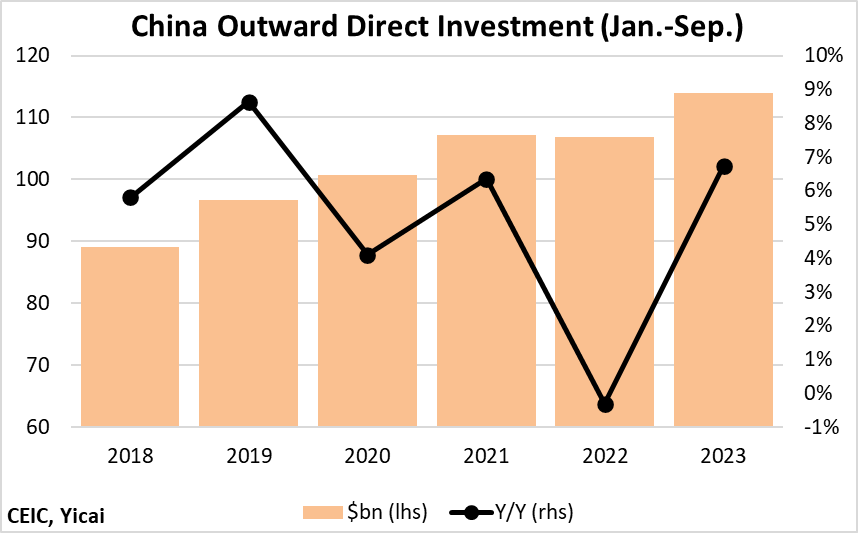
(Yicai) Nov. 28 -- China’s overseas direct investment (ODI) flows are up 7 percent in the first nine months of the year. During the January-to-September period last year, ODI flows were essentially unchanged from 2021. This year’s increase represents a return to the sorts of growth we saw before the pandemic hit (Figure 1).
Figure 1
The recovery in China’s ODI flows is interesting because direct investment elsewhere in the world, including into China and the Eurozone, has fallen off sharply this year. It appears that some of this decline is a result of low anticipated “excess returns” on direct investment projects as risk-free rates have risen.
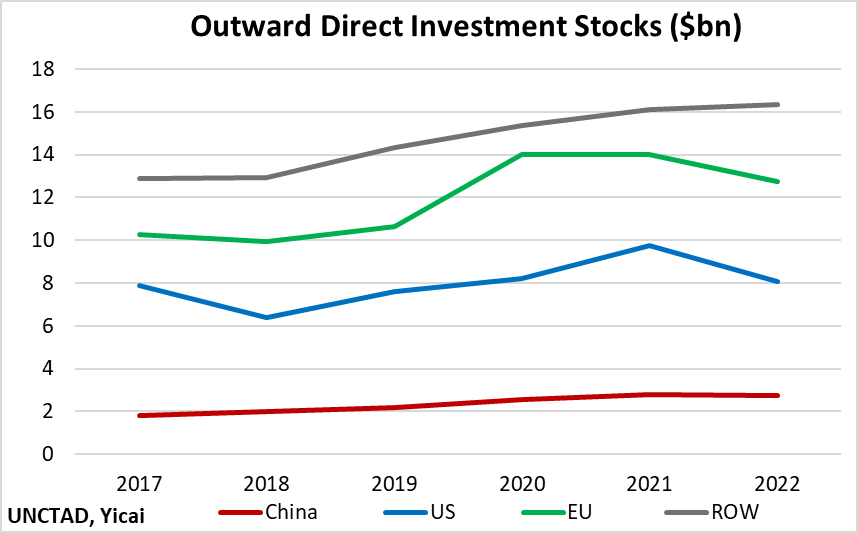
Chinese investors’ continued willingness to take cross-border risk is part of a longer-term trend. Figure 2 presents the stocks of ODI for China, the US, the EU and the rest of the world between 2017 and 2022. Over this period, China’s stock of ODI was the fastest growing. As a result, China’s share of the global ODI stock rose from 5.5 to 6.9 percent.
Figure 2
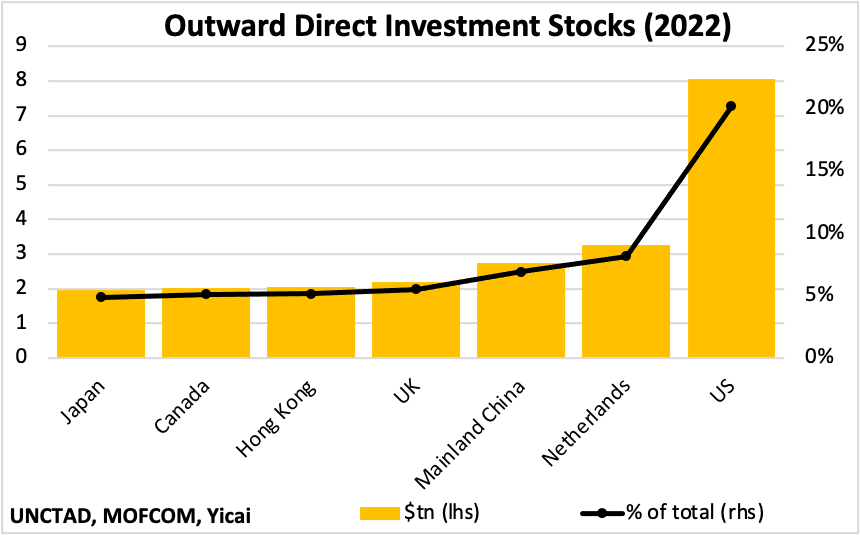
At the end of last year, China’s stock of ODI was the world’s third largest, behind the US at 20 percent and the Netherlands at 8 percent (Figure 3).
Figure 3
China’s Ministry of Commerce, the National Bureau of Statistics and the State Administration of Foreign Exchange recently released their for 2022, which provides useful analytic detail on last year’s ODI activity. However, the official data do not provide a lot of colour for the year in progress.
To get a better understanding of what has been happening this year, we turn to the (CGIT) published by the American Enterprise Institute. There are methodological differences between the way the official statistics and the CGIT capture ODI. Outbound investors are required to report their activities to the statistical agencies. In contrast, the CGIT relies on corporate disclosures for its information and it focuses on large transactions, excluding those below $95 million.
These differences in methodologies can lead to discrepancies between the two data sets in the timing, the destination and the target industrial sector of China’s ODI.
The CGIT reports the full amount of the investment when it is disclosed. However, the amount spent could be disbursed slowly over time and it is the actual investment that is recorded in the official statistics.
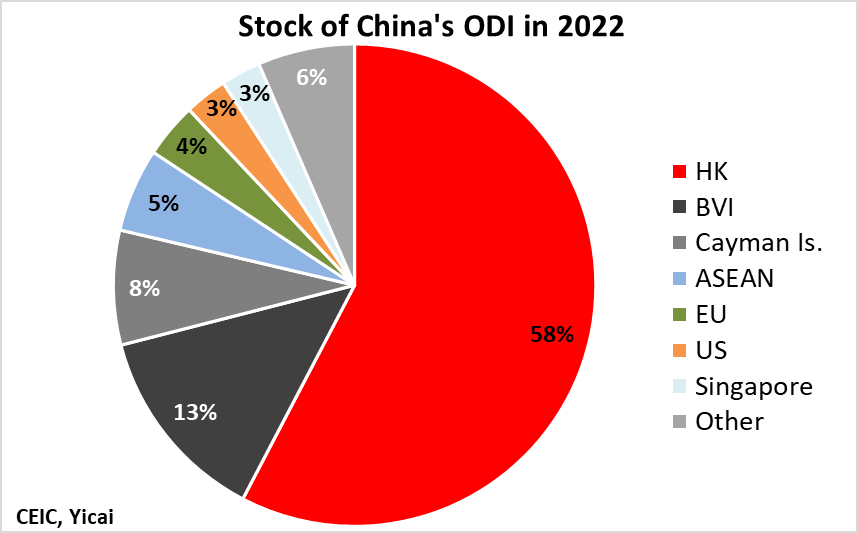
The official statistics capture the initial geographic destination as reported by the investing firm while the CGIT records the final destination of the investment. According to the official data, 58 percent of China’s stock of ODI was invested in Hong Kong as at the end of last year. An additional 21 percent was invested in the British Virgin Islands and the Cayman Islands (Figure 4). It is likely that a great deal of the funds initially sent to Hong Kong and the two offshore centers were ultimately invested in other jurisdictions.
Figure 4
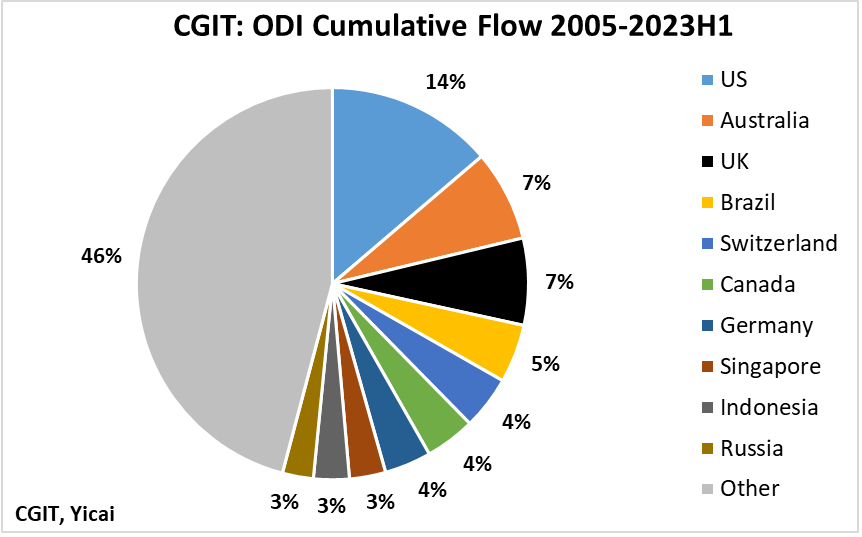
Looking at the cumulative flow of investments tracked by the CGIT since January 2005, we see that the US was the largest recipient of China’s ODI, followed by Australia and the UK (Figure 5).
Figure 5
The official data report that close to 40 percent of the stock of China’s ODI was invested in leasing and commercial services. Wholesale and retail trade (13 percent) and manufacturing (10 percent) were the next most important target industries. In contrast, the cumulative flows captured by the CGIT since 2005 suggest that energy and power (32 percent), metals (12 percent) and transportation (12 percent) were the sectors most favoured by Chinese overseas investors.
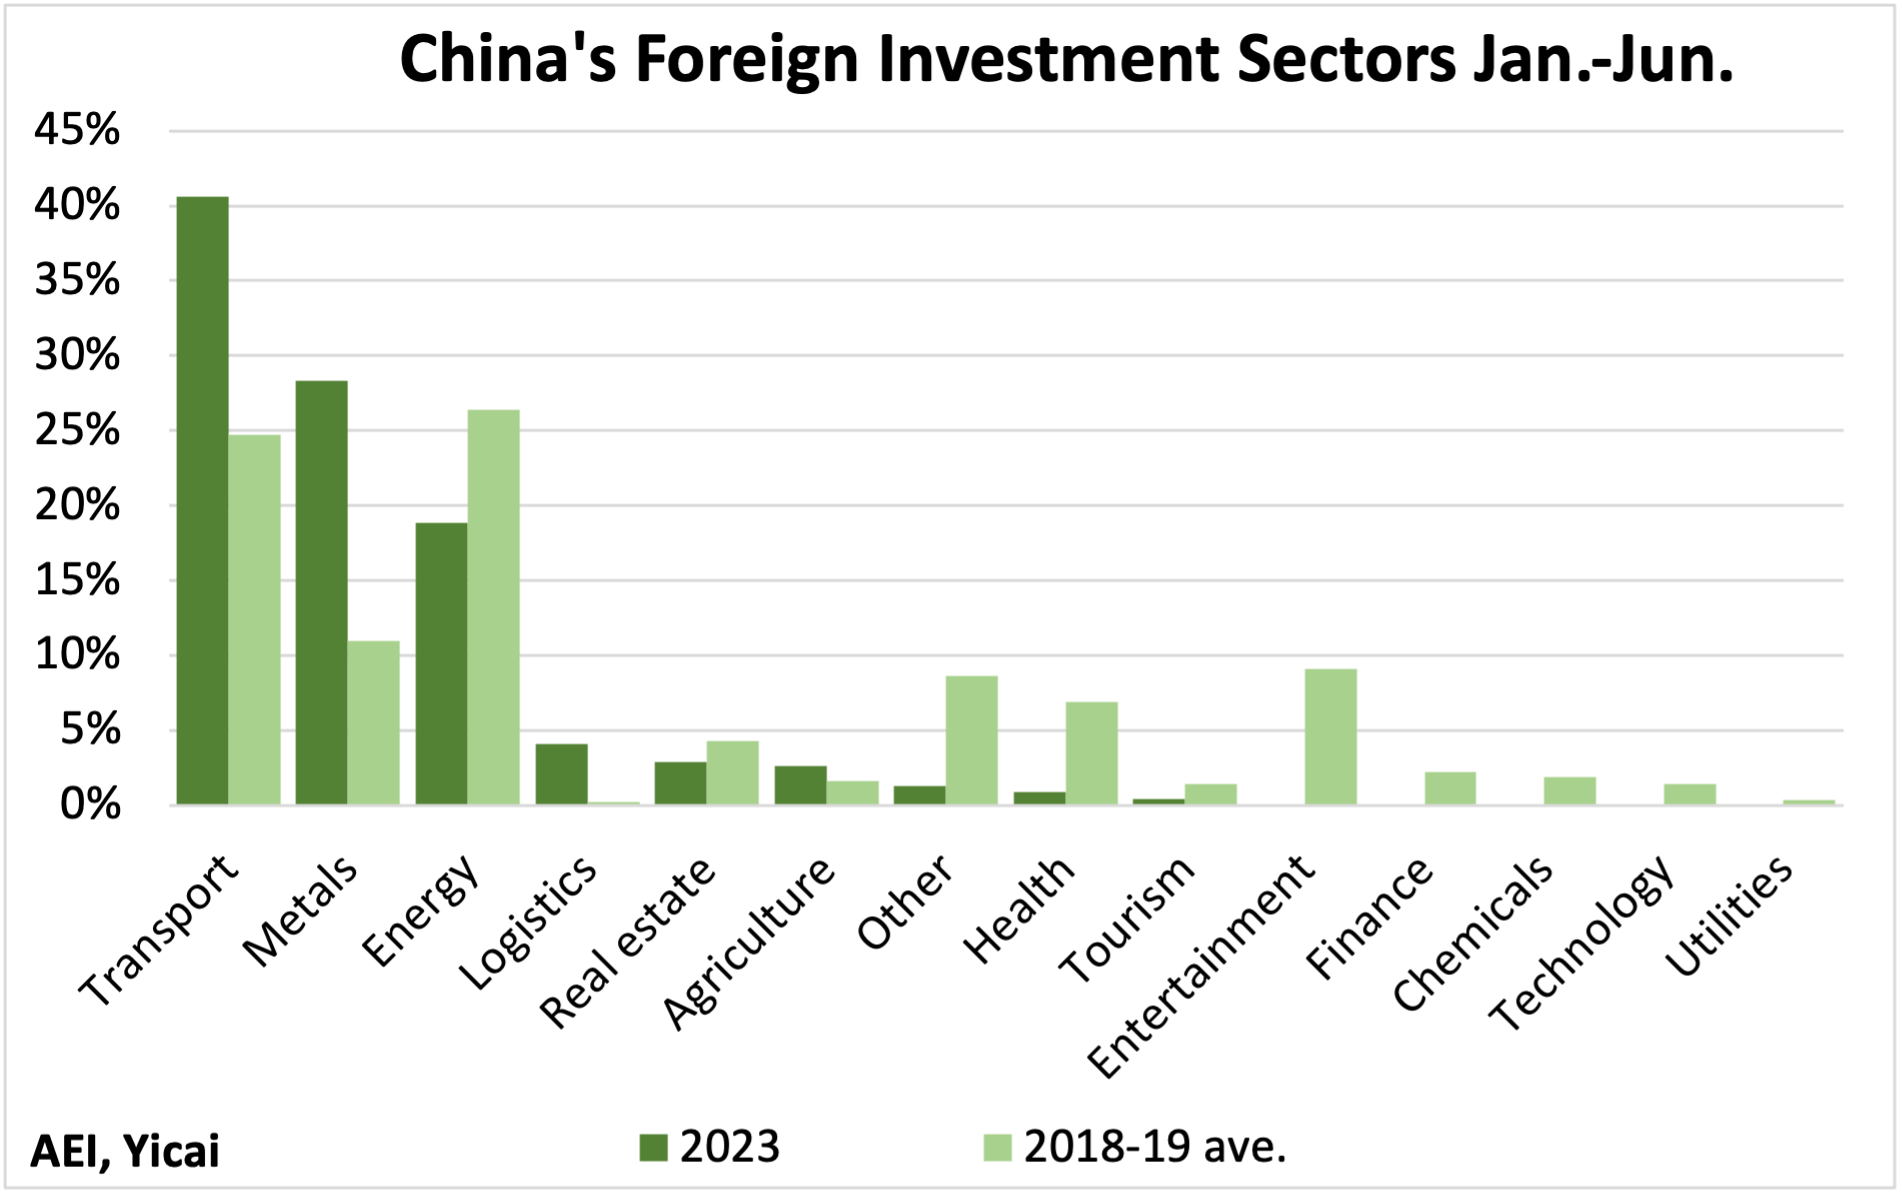
With these methodological differences in mind, I want to look at the CGIT numbers for the first half of this year and compare them to the pre-pandemic period, which I define as January-to-June in 2018 and 2019 on average, to better understand the evolution of ODI.
The CGIT data suggest that Chinese ODI flows have become slightly more concentrated in two sectors: transportation and metals. So far this year, these two sectors accounted for close to 70 percent of China’s ODI, up from 36 percent in the pre-pandemic period (Figure 6).
It seems that many of these investments are designed to augment the supply chain for electric vehicles, including the $2.3 billion Huayou Cobalt, Vale and Ford in Indonesia, Svolt’s $2 billion battery investment in Germany and Shanghai Putailai’s $1.3 billion to produce anodes in Sweden.
While energy remains an important sector for Chinese ODI this year, investment in services, such as entertainment, health and finance, has fallen off.
Figure 6
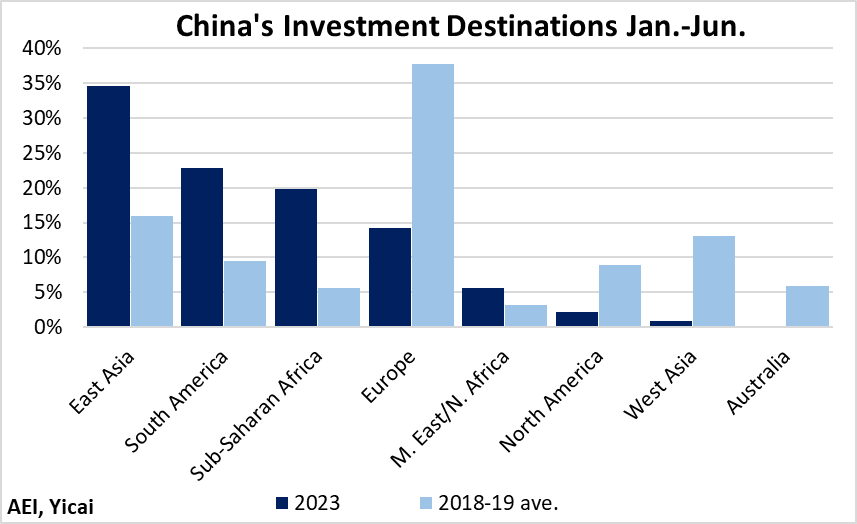
The CGIT data also show a marked change in the geographic distribution of China’s ODI so far this year, compared to the pre-pandemic period (Figure 7). More investment has flowed to East Asia, South America and Sub-Saharan Africa. In total, these three regions accounted for 77 percent of China’s ODI, up from 31 percent in 2018-19. In contrast, investments in Europe, North America and Australia only accounted for 16 percent this year, down from 53 percent in the pre-pandemic period.
Figure 7
The change in the geographic distribution of China’s ODI documented by the CGIT is consistent with the shift in these countries’ risk-return profiles. In its , the Economist Intelligence Unit (EIU) recently explored the most attractive destinations for Chinese investors. The EIU ranks the attractiveness of China’s prospective investment destinations based on 200 forward-looking quantitative indicators that are designed to measure both opportunity and risk.
Table 1 shows how the EIU’s ranking of the top 10 destinations for Mainland Chinese investment has evolved between 2013 and 2023. Only three of the top 10 destinations in 2013 – Singapore, Hong Kong and Switzerland – continued to make the top 10 list this year.
Advanced countries like the US, Japan, Australia, Norway and Germany are no longer in the top 10. The EIU notes that deteriorating bilateral relations and enhanced screening of inbound investment present
significant hurdles for Chinese investors. In particular, Chinese investment in sensitive sectors like advanced manufacturing and telecommunications now faces heightened scrutiny.
This year, the other major ASEAN countries joined Singapore in the top 10. According to the EIU, this reflects these countries’ robust growth outlook, their growing middle class, their abundant natural.
resources and their relative openness to Chinese investors. Moreover, as export hubs, these countries maintain strong supply chain ties with Chinese firms and benefit from low tariffs in key export markets.
Table 1:
Top Ten Destinations for Chinese Outward Investment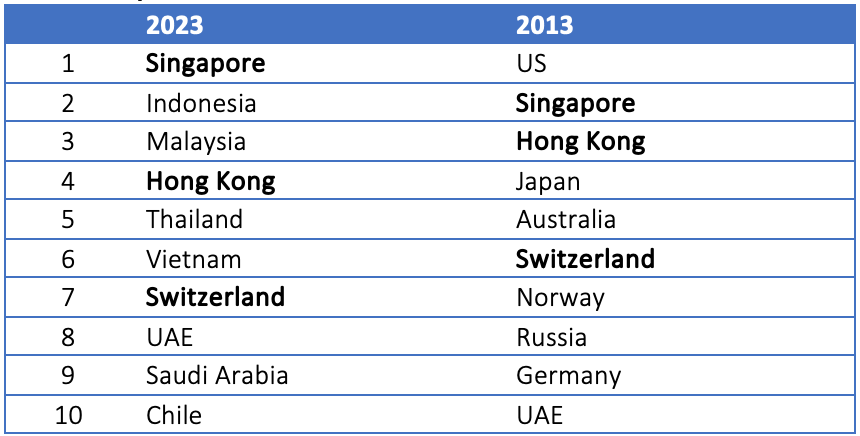
Source: EIU
There is a narrative out there that the rebound in China’s ODI represents a challenge to China’s domestic economy. According to this story, de-risking pressures from China’s trading partners are leading domestic firms to offshore their production, with negative effects on Chinese employment and economic growth.
It does look like protectionist policies are leading to a shift in the geographic distribution of China’s ODI. However, ODI’s sectoral composition remains pretty close to what we saw before the pandemic, with transport, metals and energy retaining their dominant position. We do not see widespread offshoring of manufacturing to other countries.
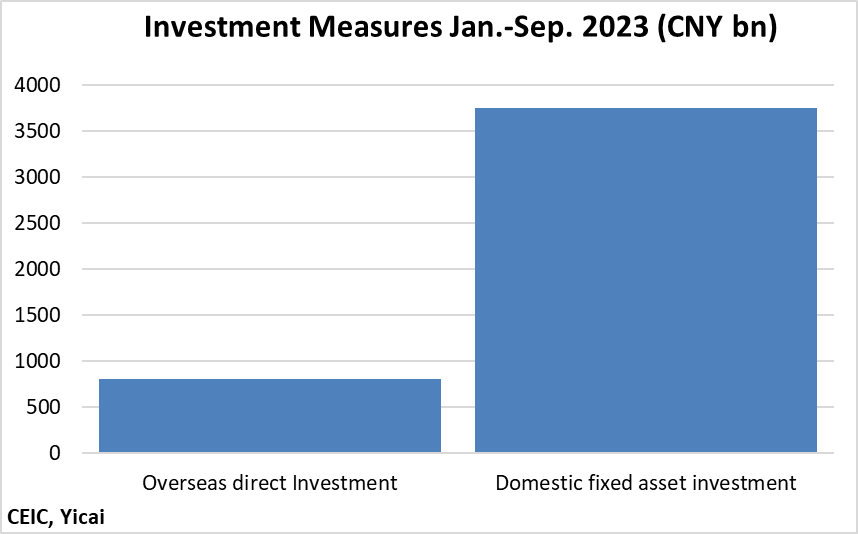
In addition, we need to keep the scale of China’s ODI in perspective. Based on the official data for the year-to-date, China will record historic ODI flows this year. In contrast, the property market downturn has contributed to sluggish domestic fixed asset investment. Still, so far this year, domestic fixed asset investment has been close to five times the size of ODI (Figure 8). It is unlikely that the tail is wagging the dog.
Rather than being a substitute for domestic investment, empirical research finds that Chinese ODI is actually complementary to domestic production. show that ODI increases the sophistication of Chinese exports. This allows the domestic economy to raise its productivity and catch up more quickly to advanced countries.
Figure 8
The data show that Chinese firms continue to invest in the sectors they know best. With the demand for electric vehicles on the rise, it makes sense for them to reinforce their supply chain connections. It is also rational for them to produce electric vehicles in their target markets. This not only helps cool protectionist pressures but also keeps producers better aligned with foreign consumer trends.